
Table Of Content
- How IBM Granite 4.0 Enhances Local Chart and Document Extraction?
- Setup for Local Inference
- Environment
- Model download and LoRA merge
- Inference patterns for charts, tables, and documents
- Charts to CSV, summary, and code
- Tables to HTML and OTSL
- Invoices and forms to JSON
- Architecture notes
- Step-by-step: local workflow
- Use cases
- Final thoughts

How IBM Granite 4.0 Enhances Local Chart and Document Extraction?
Table Of Content
- How IBM Granite 4.0 Enhances Local Chart and Document Extraction?
- Setup for Local Inference
- Environment
- Model download and LoRA merge
- Inference patterns for charts, tables, and documents
- Charts to CSV, summary, and code
- Tables to HTML and OTSL
- Invoices and forms to JSON
- Architecture notes
- Step-by-step: local workflow
- Use cases
- Final thoughts
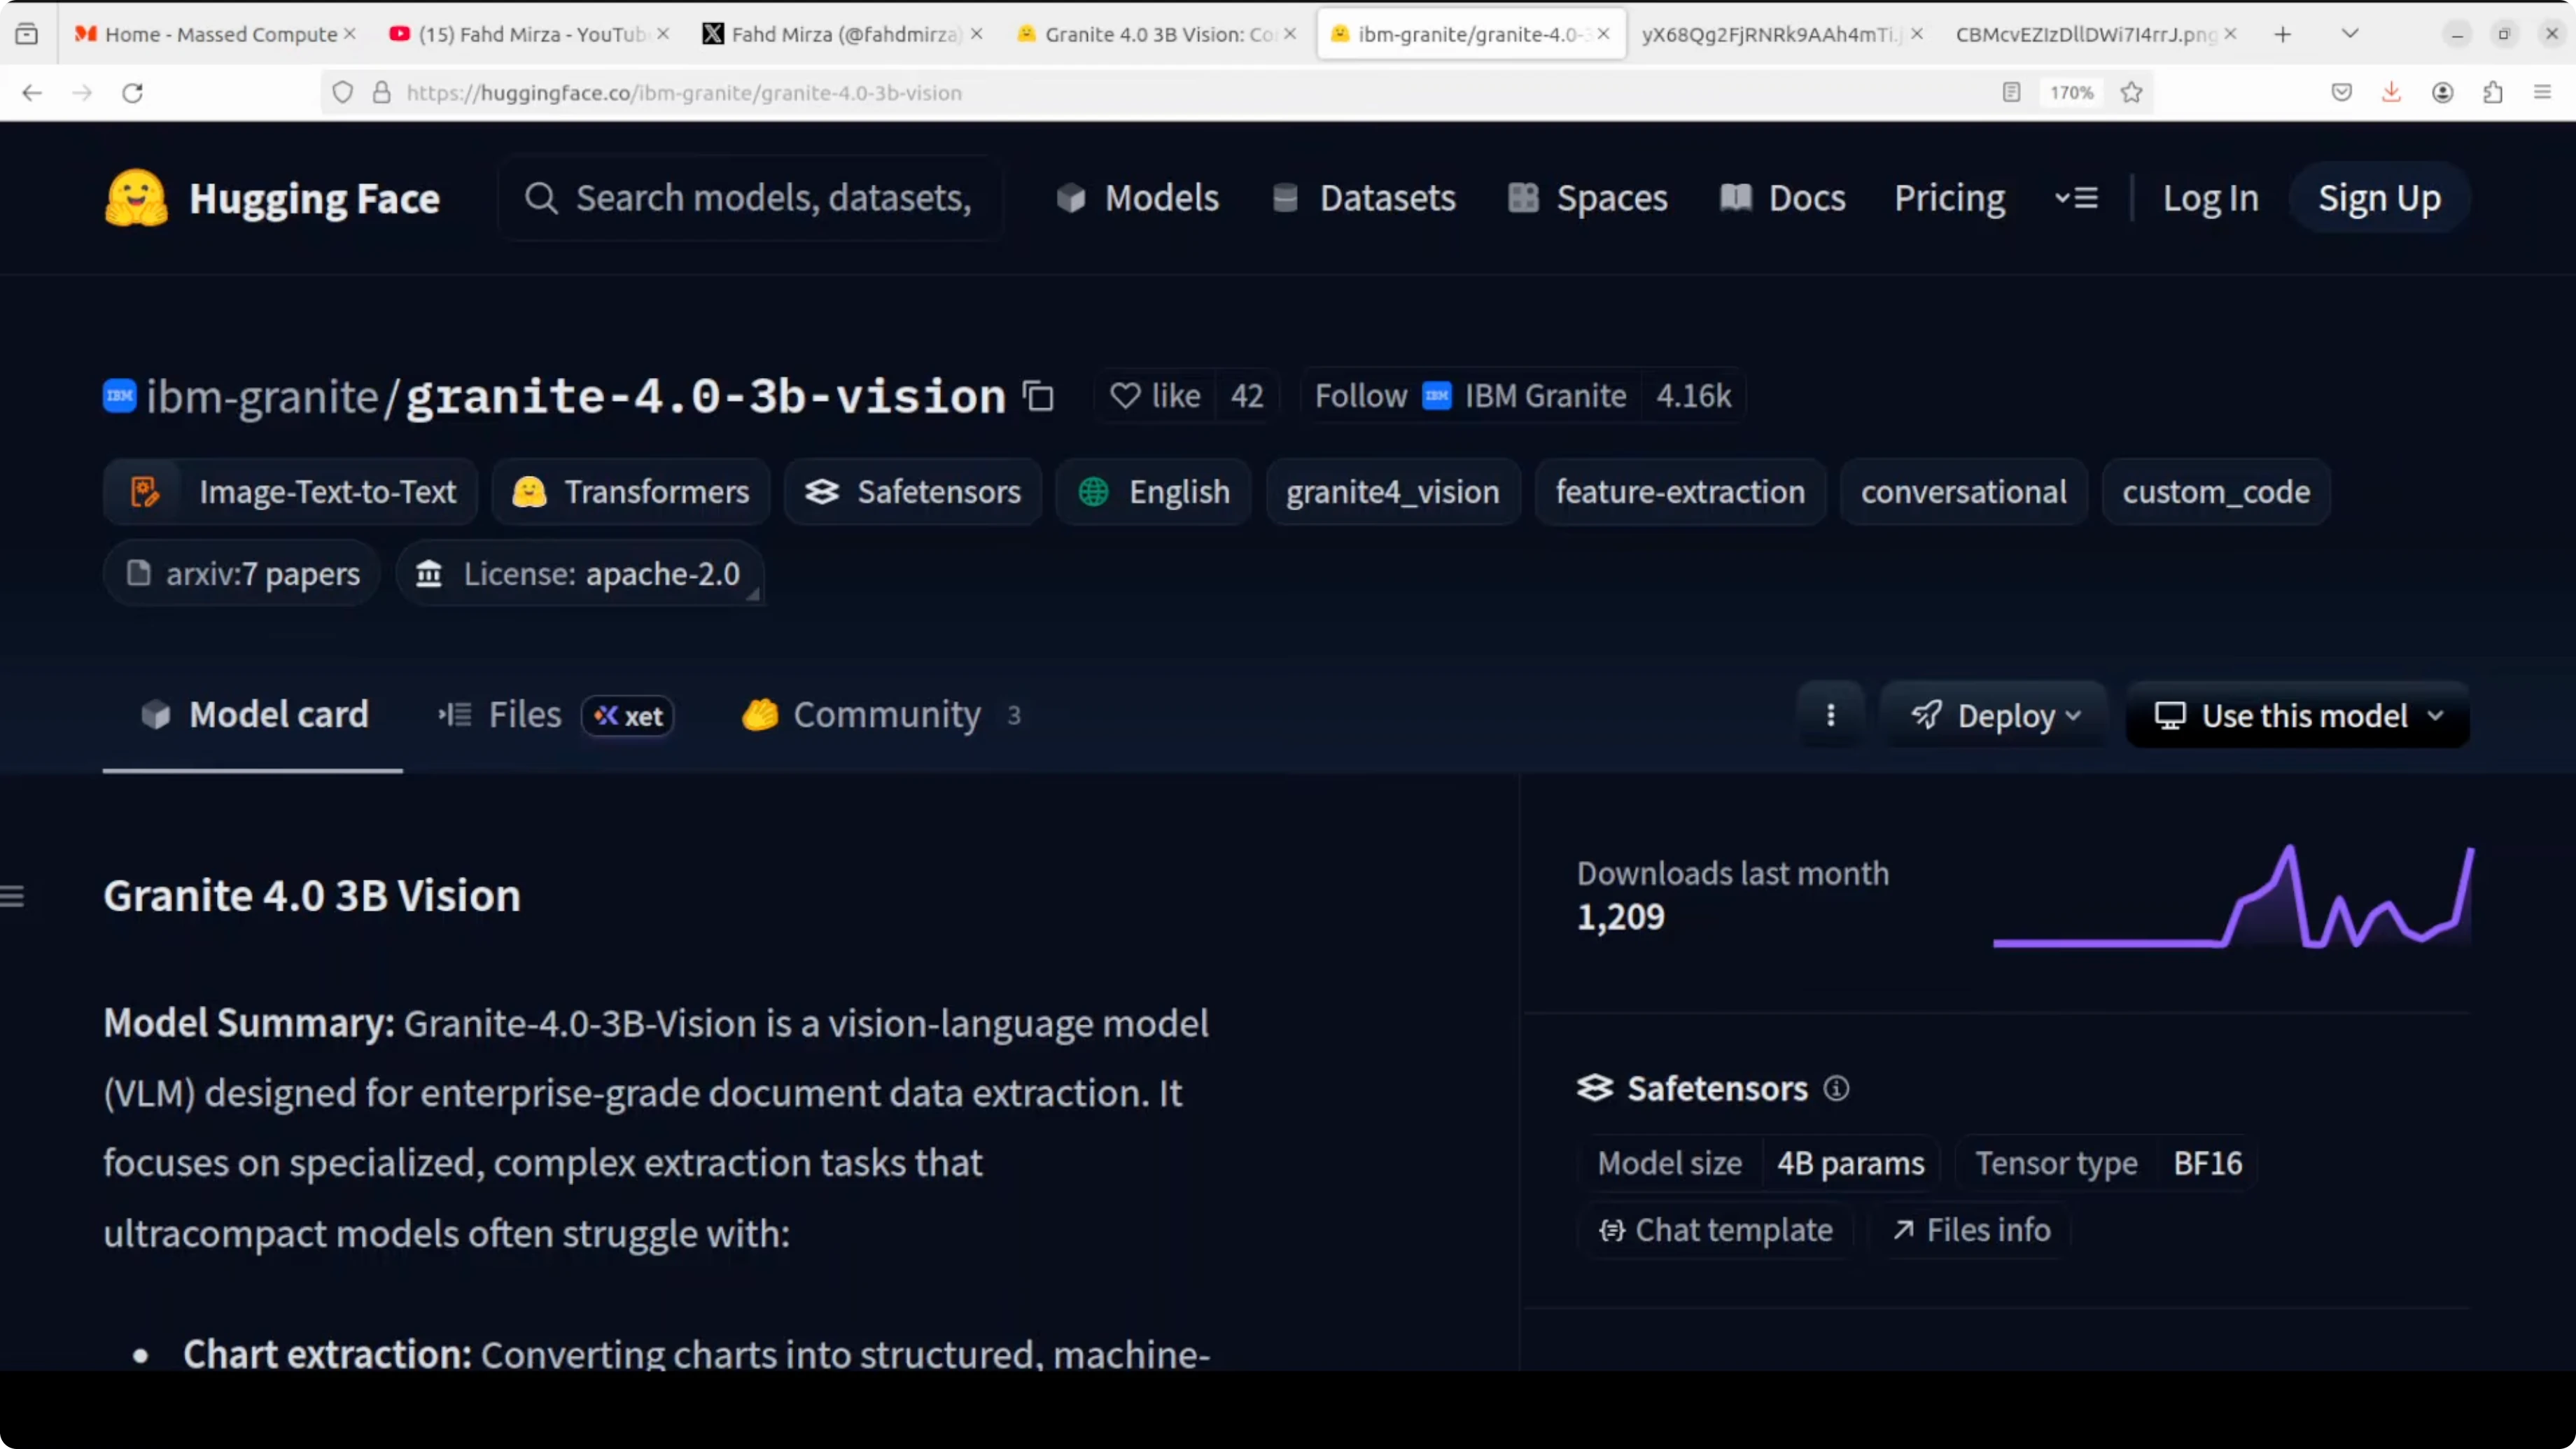
IBM took its time to release the first model of the year, and the result is worth a look. Granite 4 3B Vision arrives as a compact vision-language model focused on enterprise document extraction with an Apache open license. I have been following IBM models since day zero, and this one continues that steady evolution.
It builds on the Granite 4 Micro base released about six months ago with a small LoRA head on top for vision. For broader context on the family, see the Granite 4 overview and the Granite 4 Micro details. I set it up locally on Ubuntu with an Nvidia RTX 6000 (48 GB VRAM) and kept notes below.
How IBM Granite 4.0 Enhances Local Chart and Document Extraction?
Granite 4 3B Vision is a 3.5 billion parameter dense language model. The backbone is Granite 4 Micro, plus roughly 0.5 billion LoRA adapter parameters injected for vision at inference. The same deployment serves both text-only and vision workloads by loading or skipping the adapter.
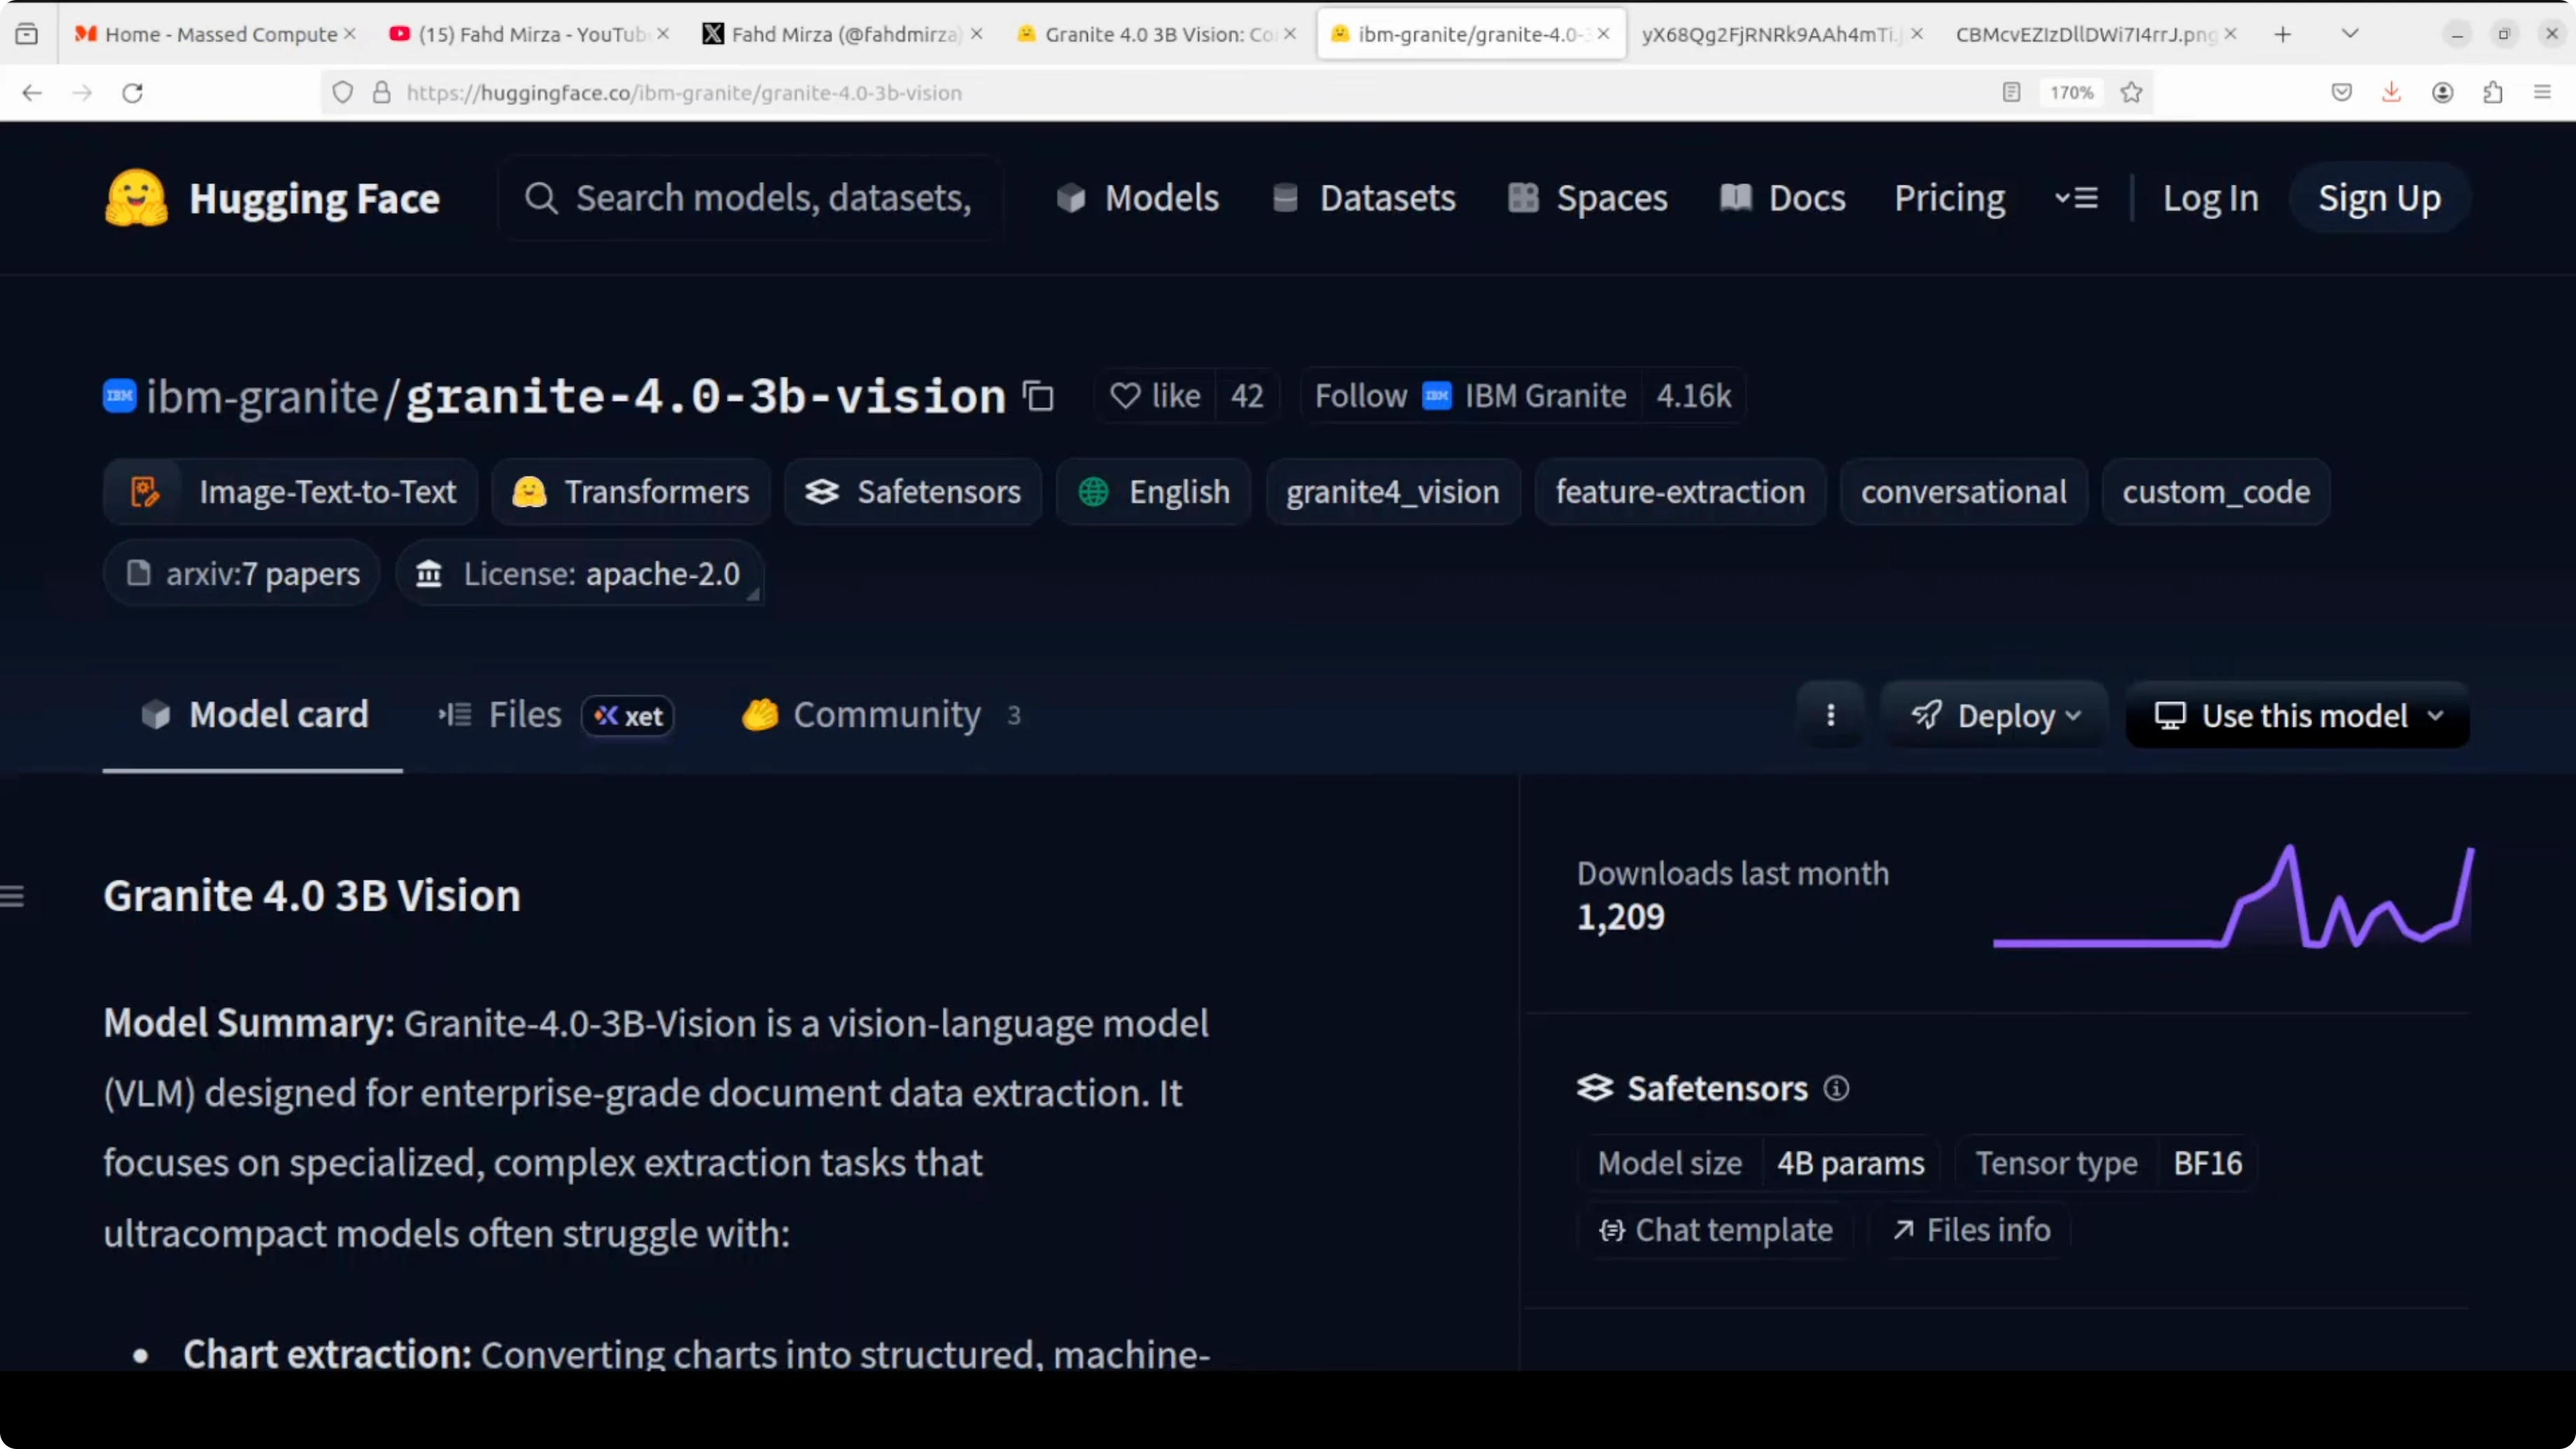
Image encoding uses SigLIP instead of injecting a single visual token stream at one point. IBM routes abstract visual features into earlier transformer layers using what they call a deep stack, with eight total injection points distributed across the network. That spatial awareness shows up on document tasks where layout and structure matter.
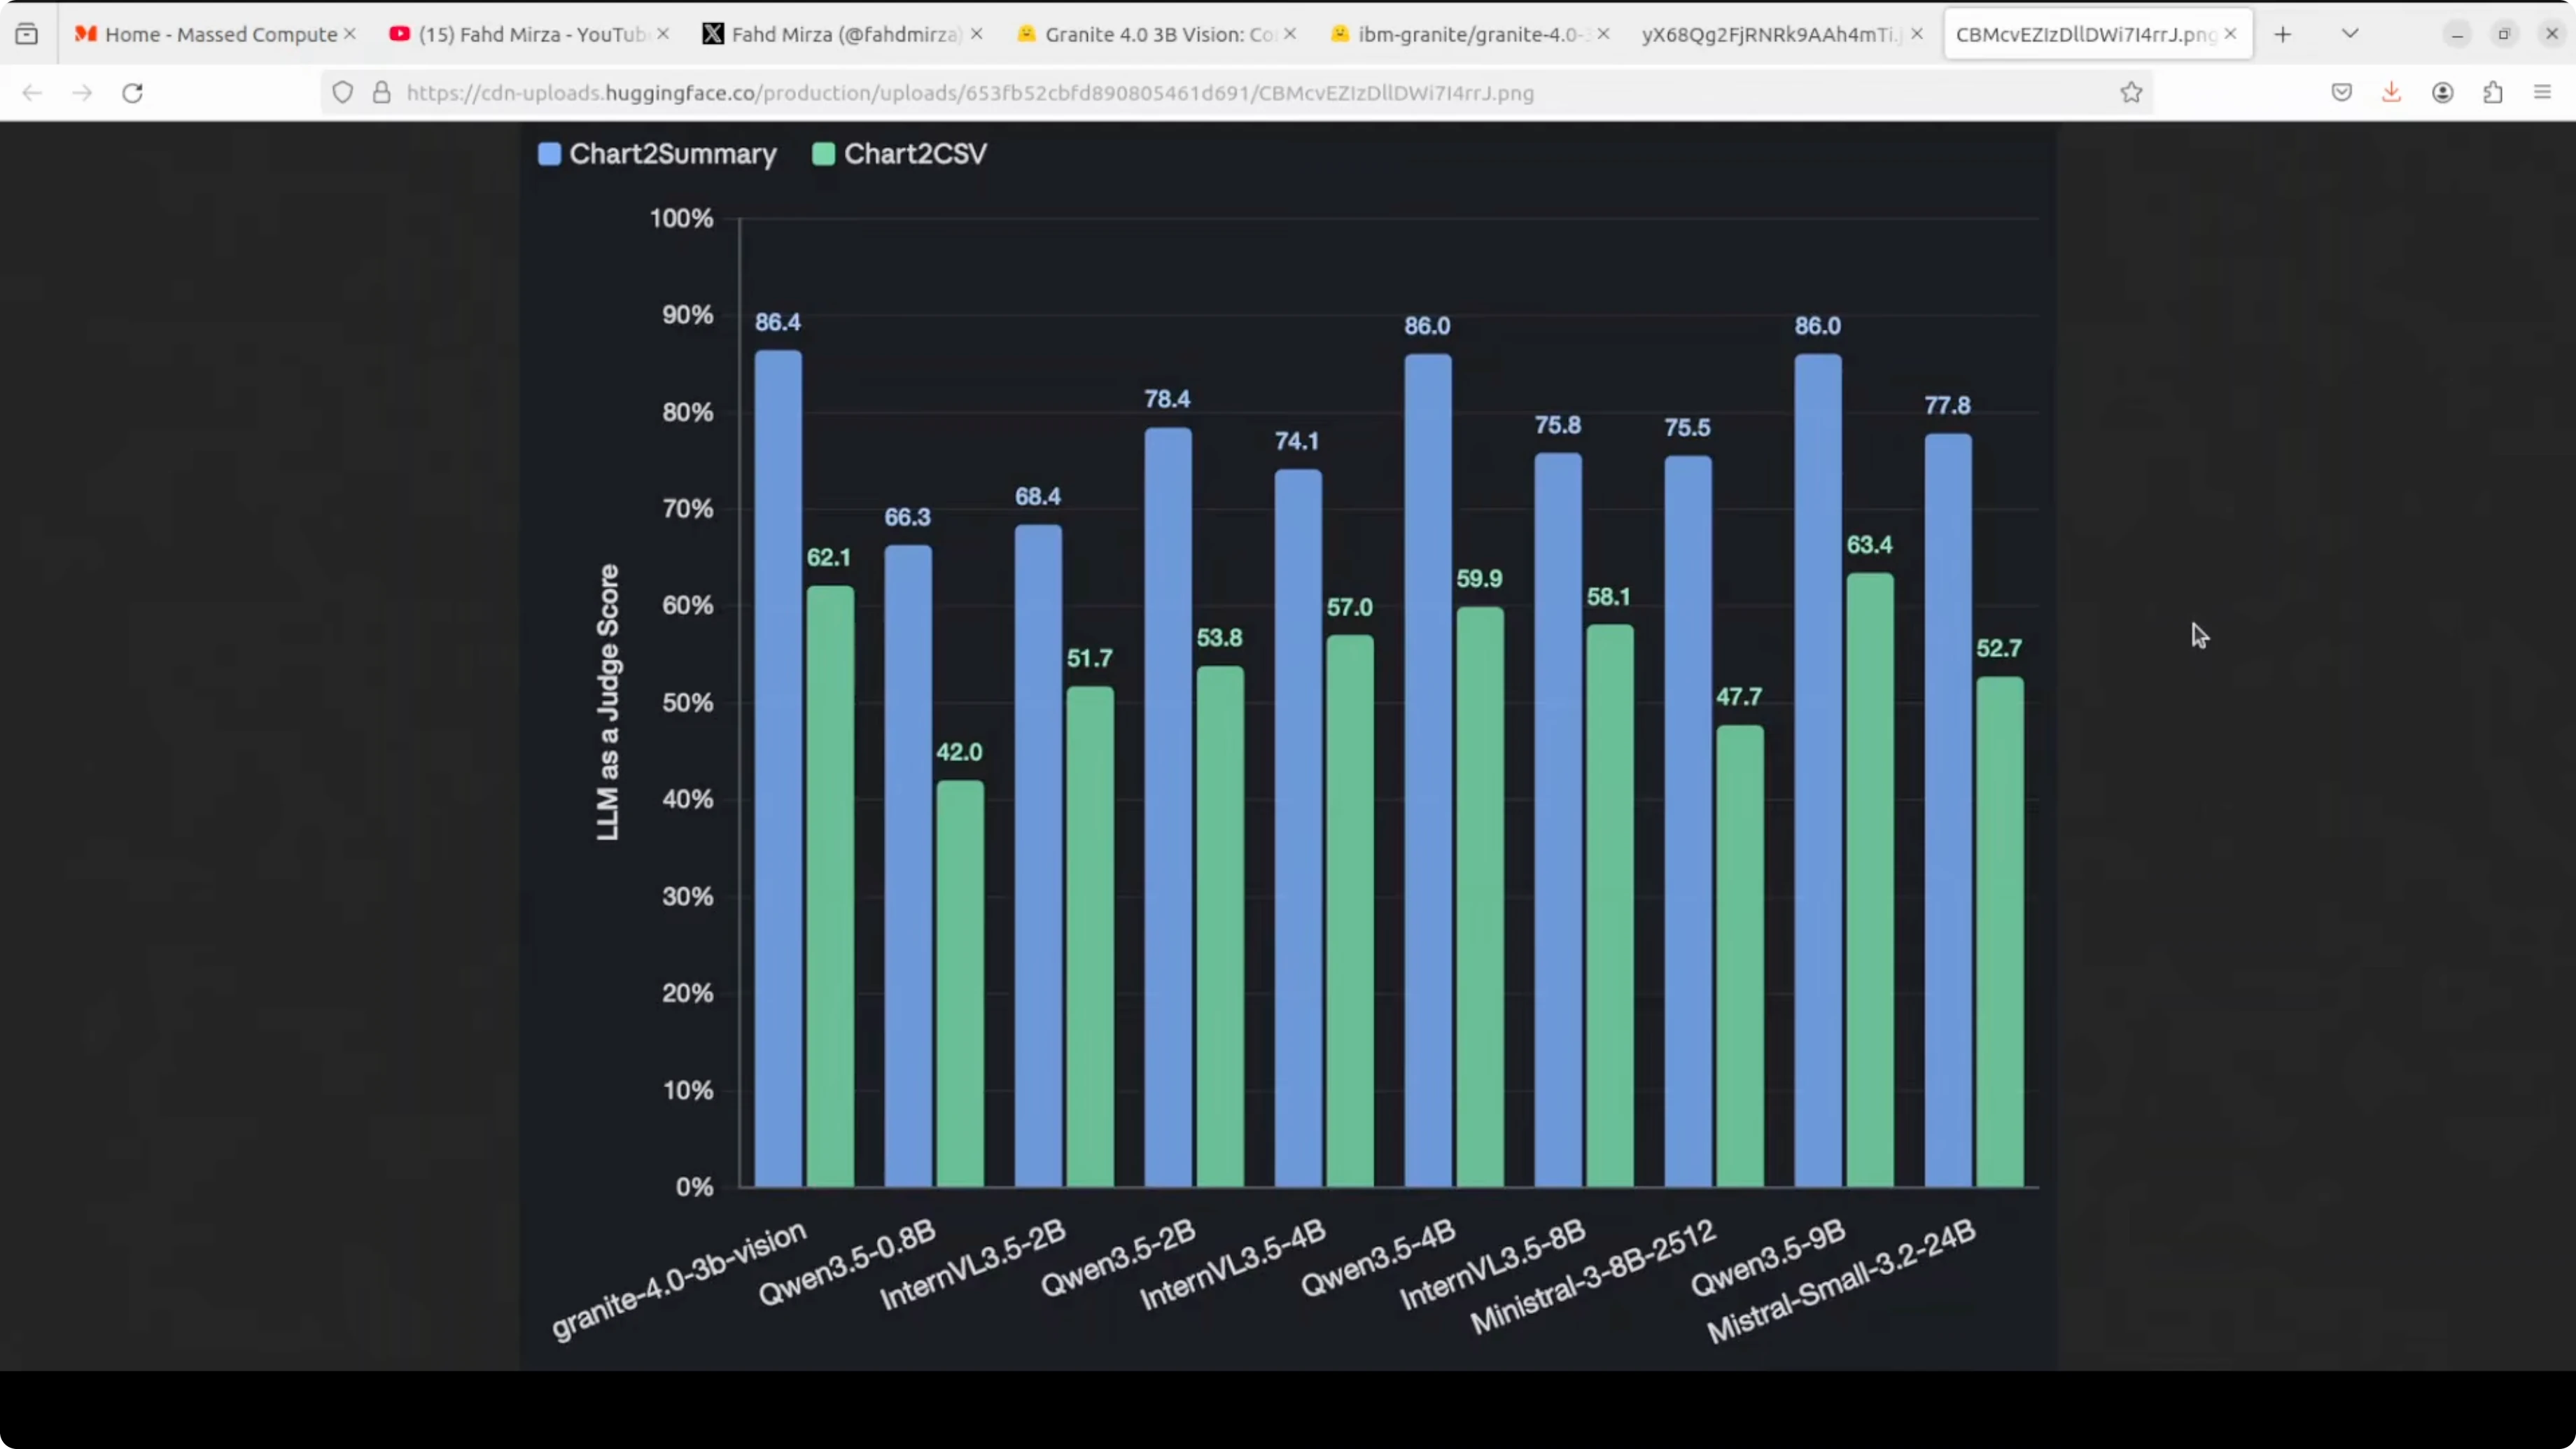
On chart understanding, IBM created a synthetic pipeline called ChartNet. A seed chart is passed to a VLM that emits Python plotting code to reconstruct it, then a code LLM augments that code into new chart variants across 24 chart types and six plotting libraries. Each sample packs five aligned parts: plotting code, rendered image, source table, a natural language summary, and a QA pair.
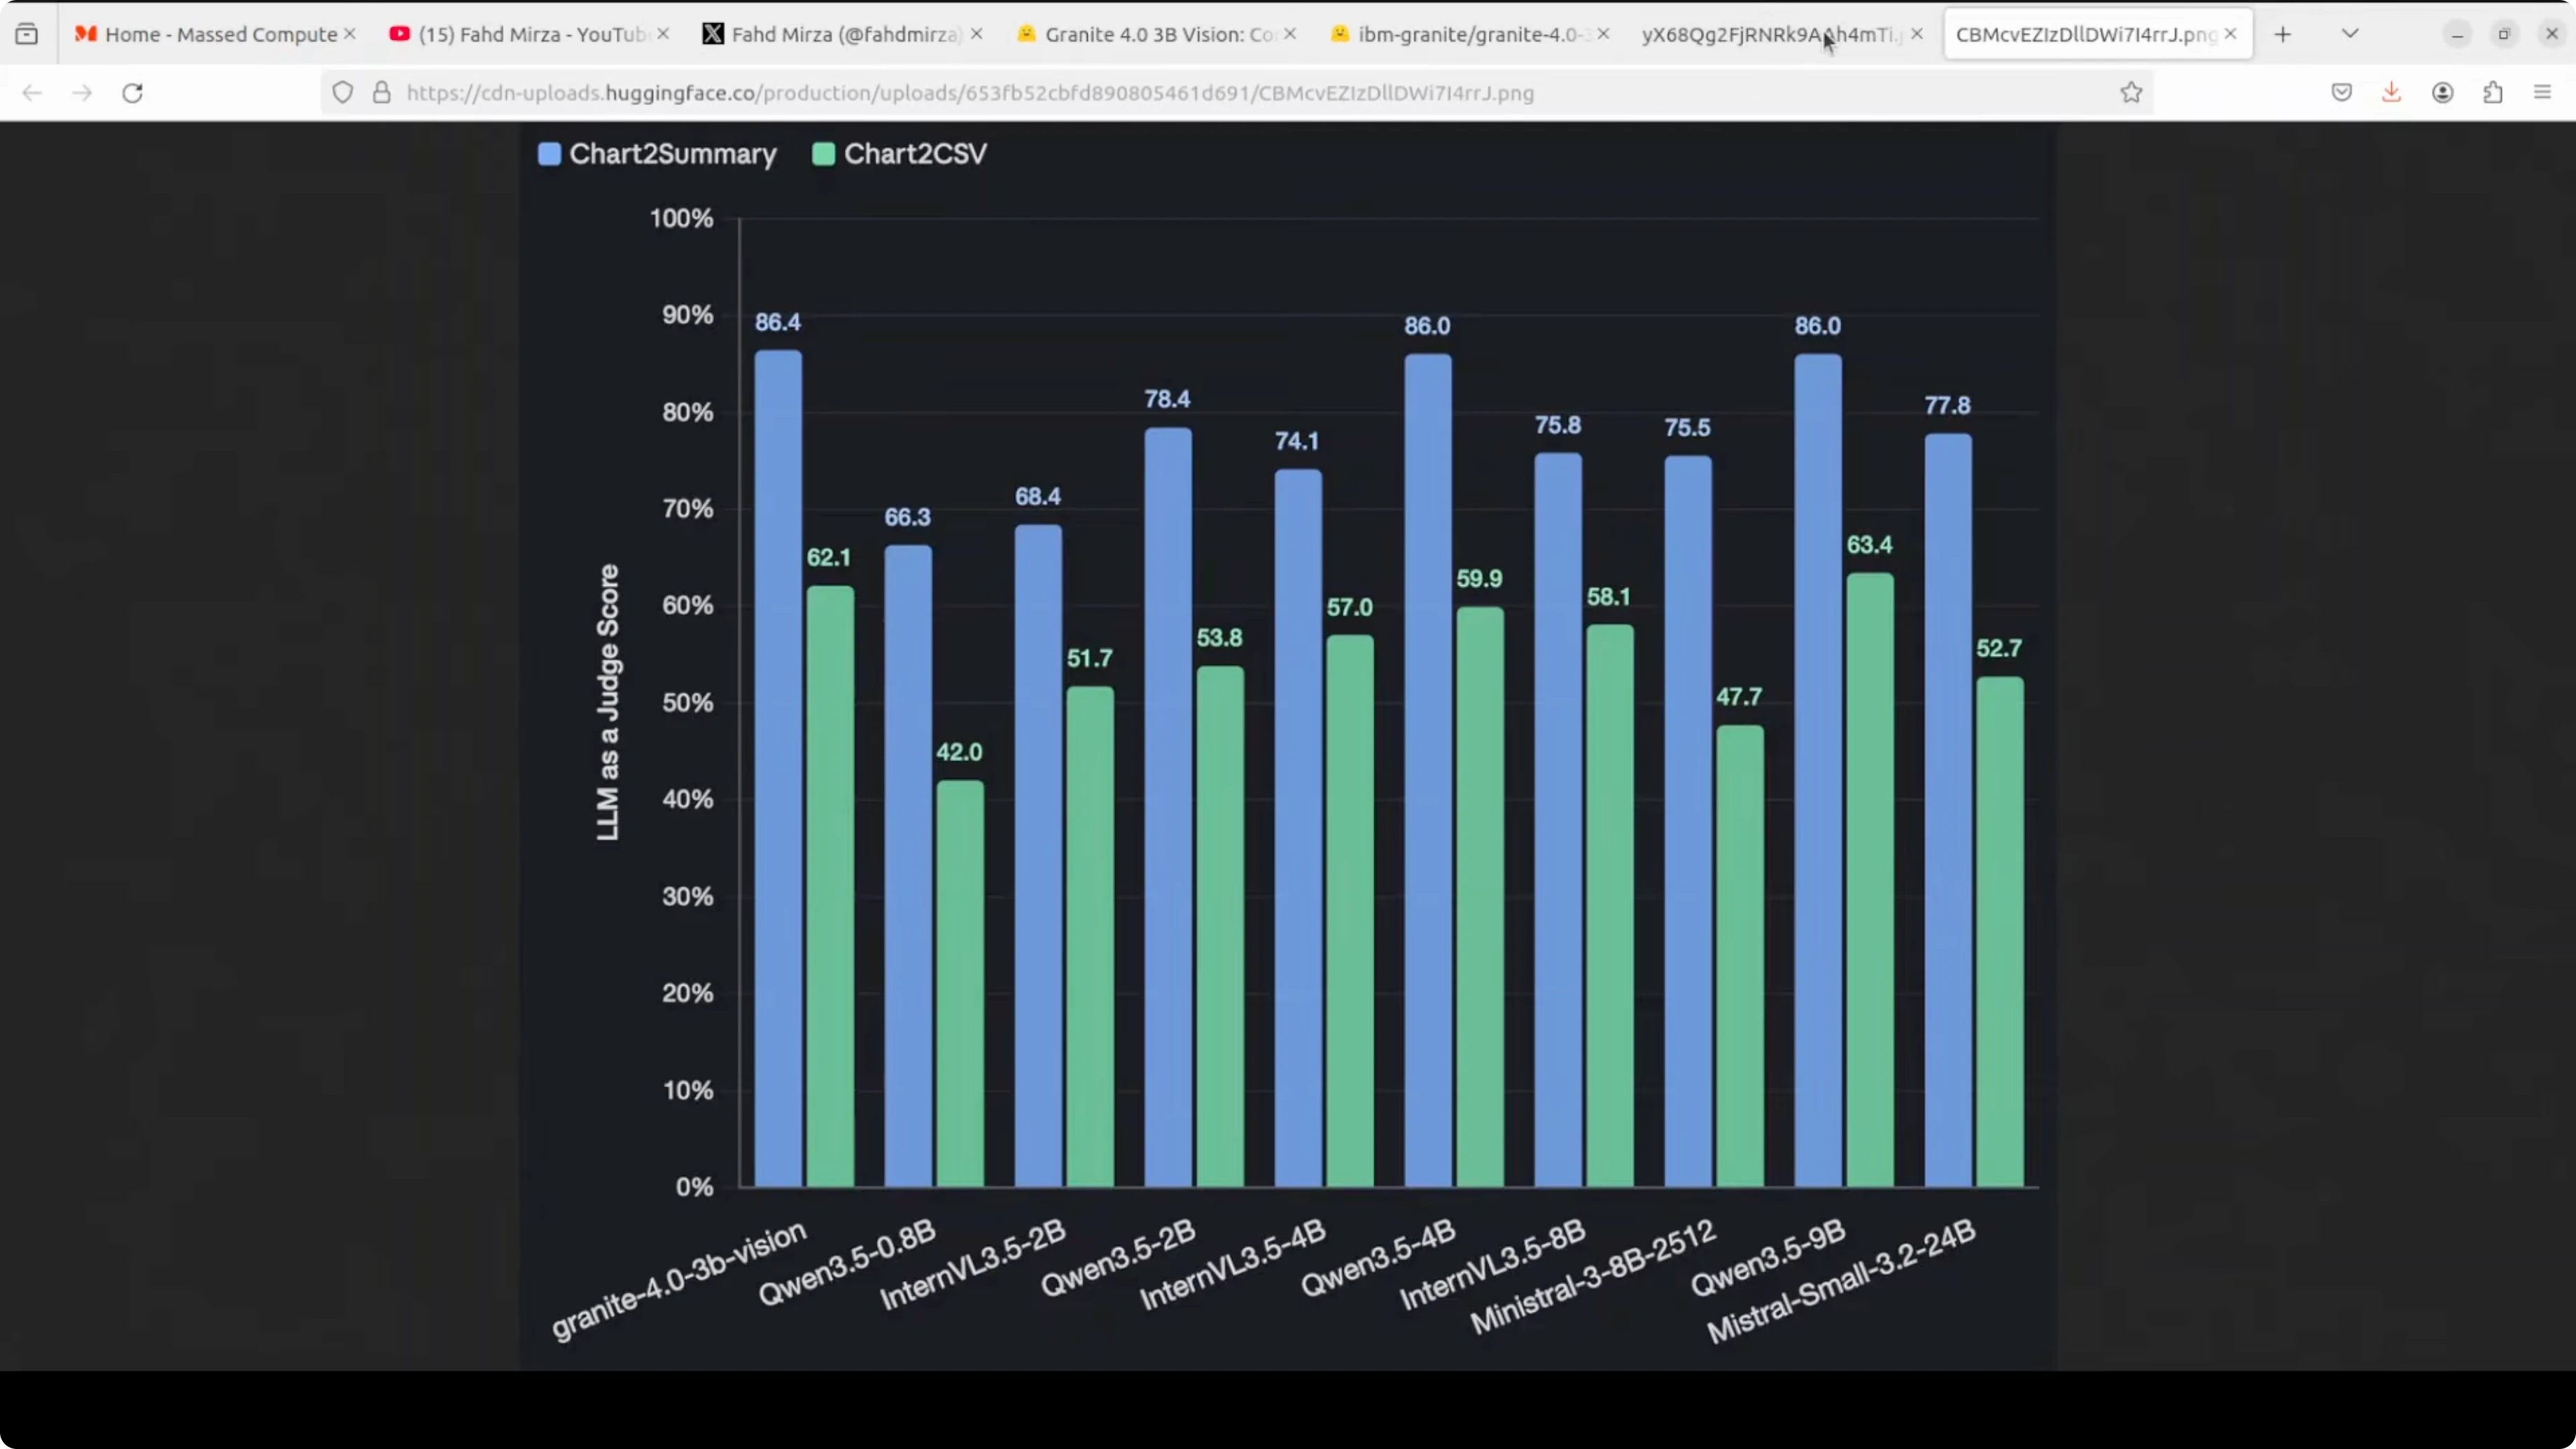
Granite 4 3B Vision reached 86.4% on chart-to-summary in their reported benchmark. That tops every model in the table, including one twice the size. The license is friendly, and you can run it locally without friction.
Setup for Local Inference
I used Ubuntu with CUDA and a recent Nvidia driver. VRAM consumption during vision inference hovered around a bit over 12 GB for my runs. That leaves headroom for batch work on a 24 GB card if you keep max tokens and image resolution modest.
Environment
Create and activate a virtual environment.
python -m venv .venv
source .venv/bin/activate
python -m pip install --upgrade pip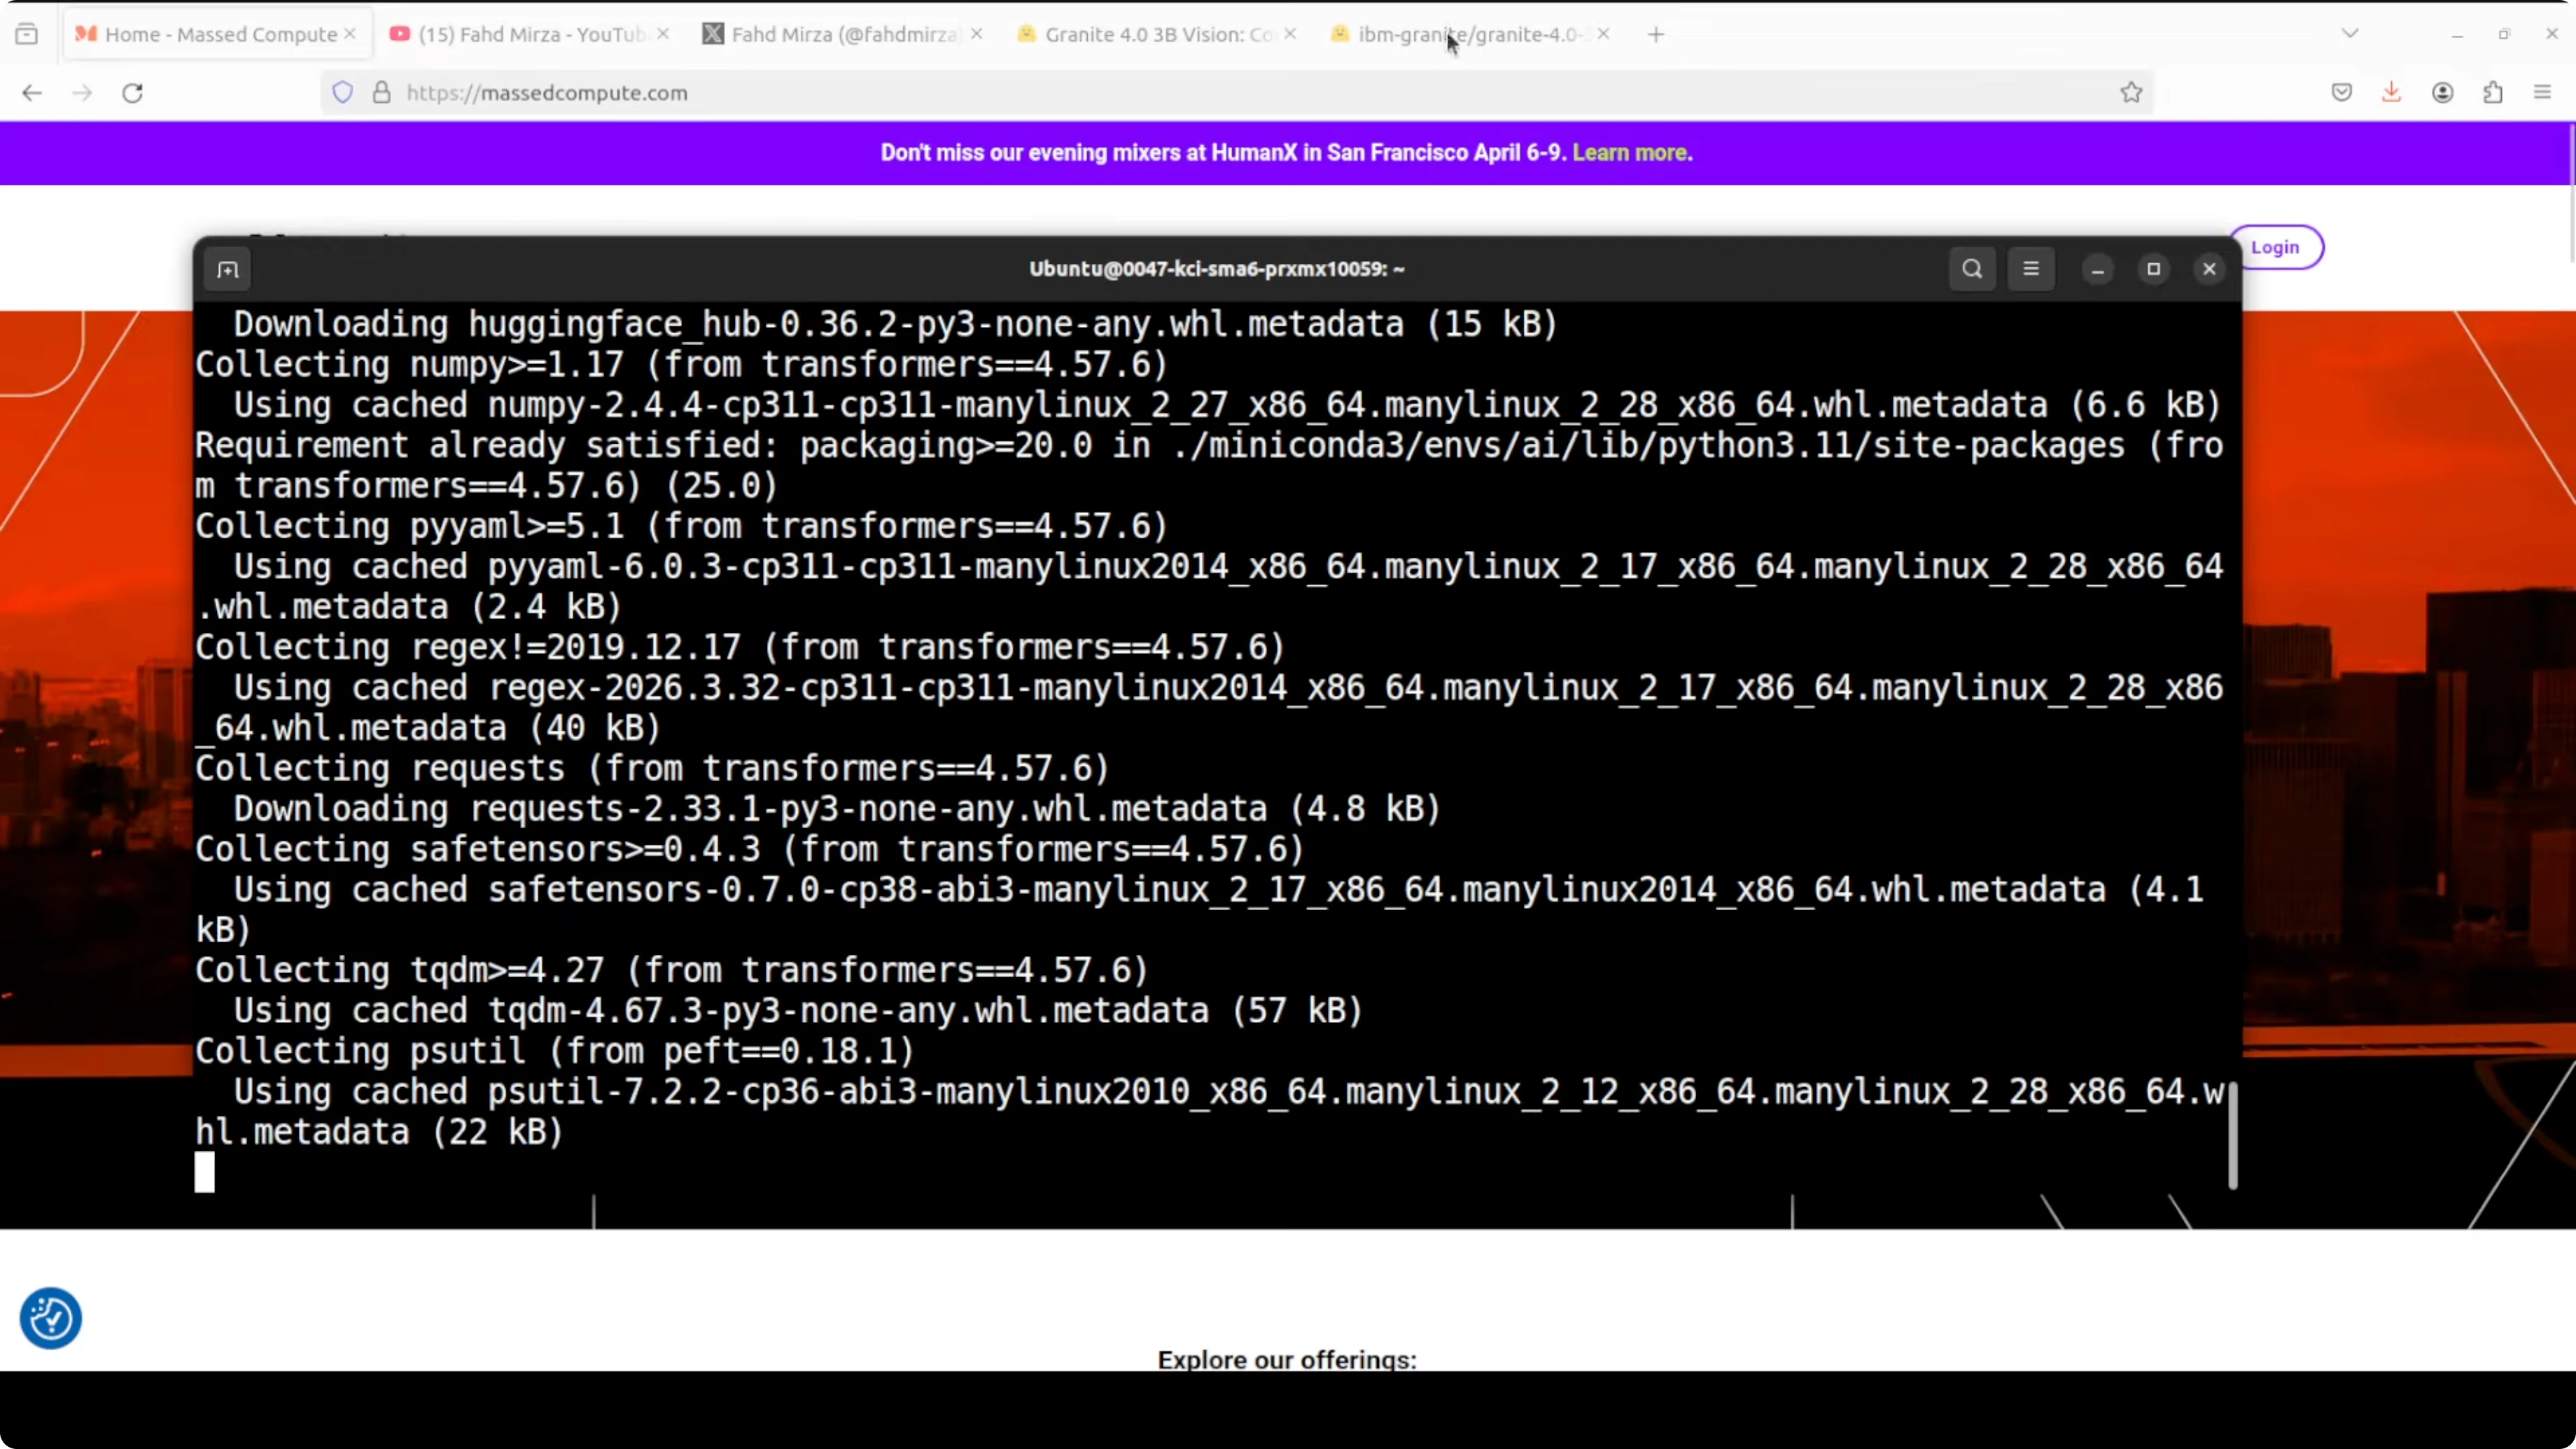
Install core packages.
pip install "torch>=2.2" "transformers>=4.39" "accelerate>=0.27" "peft>=0.10" sentencepiece safetensors pillow datasets
pip install jupyter matplotlib numpy
Login to the Hugging Face CLI and start Jupyter.
huggingface-cli login
jupyter notebook
Model download and LoRA merge
Granite 4 3B Vision ships as a base language model plus a LoRA vision adapter. Download both and merge for a single artifact you can deploy.
export BASE_MODEL_ID="ibm-granite/REPLACE_WITH_GRANITE_4_MICRO_BASE"
export ADAPTER_ID="ibm-granite/REPLACE_WITH_3B_VISION_LORA_ADAPTER"
python - <<'PY'
import torch
from transformers import AutoModelForCausalLM, AutoTokenizer
from peft import PeftModel

base = AutoModelForCausalLM.from_pretrained(
    getenv := __import__("os").getenv,
    pretrained_model_name_or_path=getenv("BASE_MODEL_ID"),
    device_map="auto",
    torch_dtype=torch.float16
)
tok = AutoTokenizer.from_pretrained(getenv("BASE_MODEL_ID"))

lora = PeftModel.from_pretrained(
    base,
    pretrained_model_name_or_path=getenv("ADAPTER_ID")
)

merged = lora.merge_and_unload()
save_dir = "granite-4-3b-vision-merged"
merged.save_pretrained(save_dir, safe_serialization=True)
tok.save_pretrained(save_dir)
print(f"Merged model saved to {save_dir}")
PY
If you prefer to keep the adapter separate, you can load the base and apply the adapter at runtime. Merging is convenient for single-file deployment and reduces extra memory hops.
Inference patterns for charts, tables, and documents
The model handles three high-value workloads locally: charts to data or code, tables to structured markup, and key-value extraction from invoices and forms. I’ll outline prompts and minimal scaffolding so you can wire your inputs and outputs cleanly. Use your own images for production runs.
Charts to CSV, summary, and code
You can feed a chart image and ask for any of the three targets: a CSV of the underlying data, a concise English summary, or Python plotting code that recreates the chart. The ChartNet training pipeline helps the model generalize across many chart styles and libraries.
from PIL import Image
import torch
from transformers import AutoProcessor, AutoModelForCausalLM
MODEL_DIR = "granite-4-3b-vision-merged"
processor = AutoProcessor.from_pretrained(MODEL_DIR)
model = AutoModelForCausalLM.from_pretrained(
MODEL_DIR, device_map="auto", torch_dtype=torch.float16
)
def generate(image_path, prompt, max_new_tokens=1024):
image = Image.open(image_path).convert("RGB")
inputs = processor(text=prompt, images=image, return_tensors="pt").to(model.device)
with torch.no_grad():
out = model.generate(**inputs, max_new_tokens=max_new_tokens)
return processor.decode(out[0], skip_special_tokens=True)
chart_path = "path/to/your/chart.png"
csv_prompt = (
"You are a chart extraction assistant. "
"Return only CSV with header and numeric values reconstructed from the chart image. "
"Use commas, one row per line, no commentary."
)
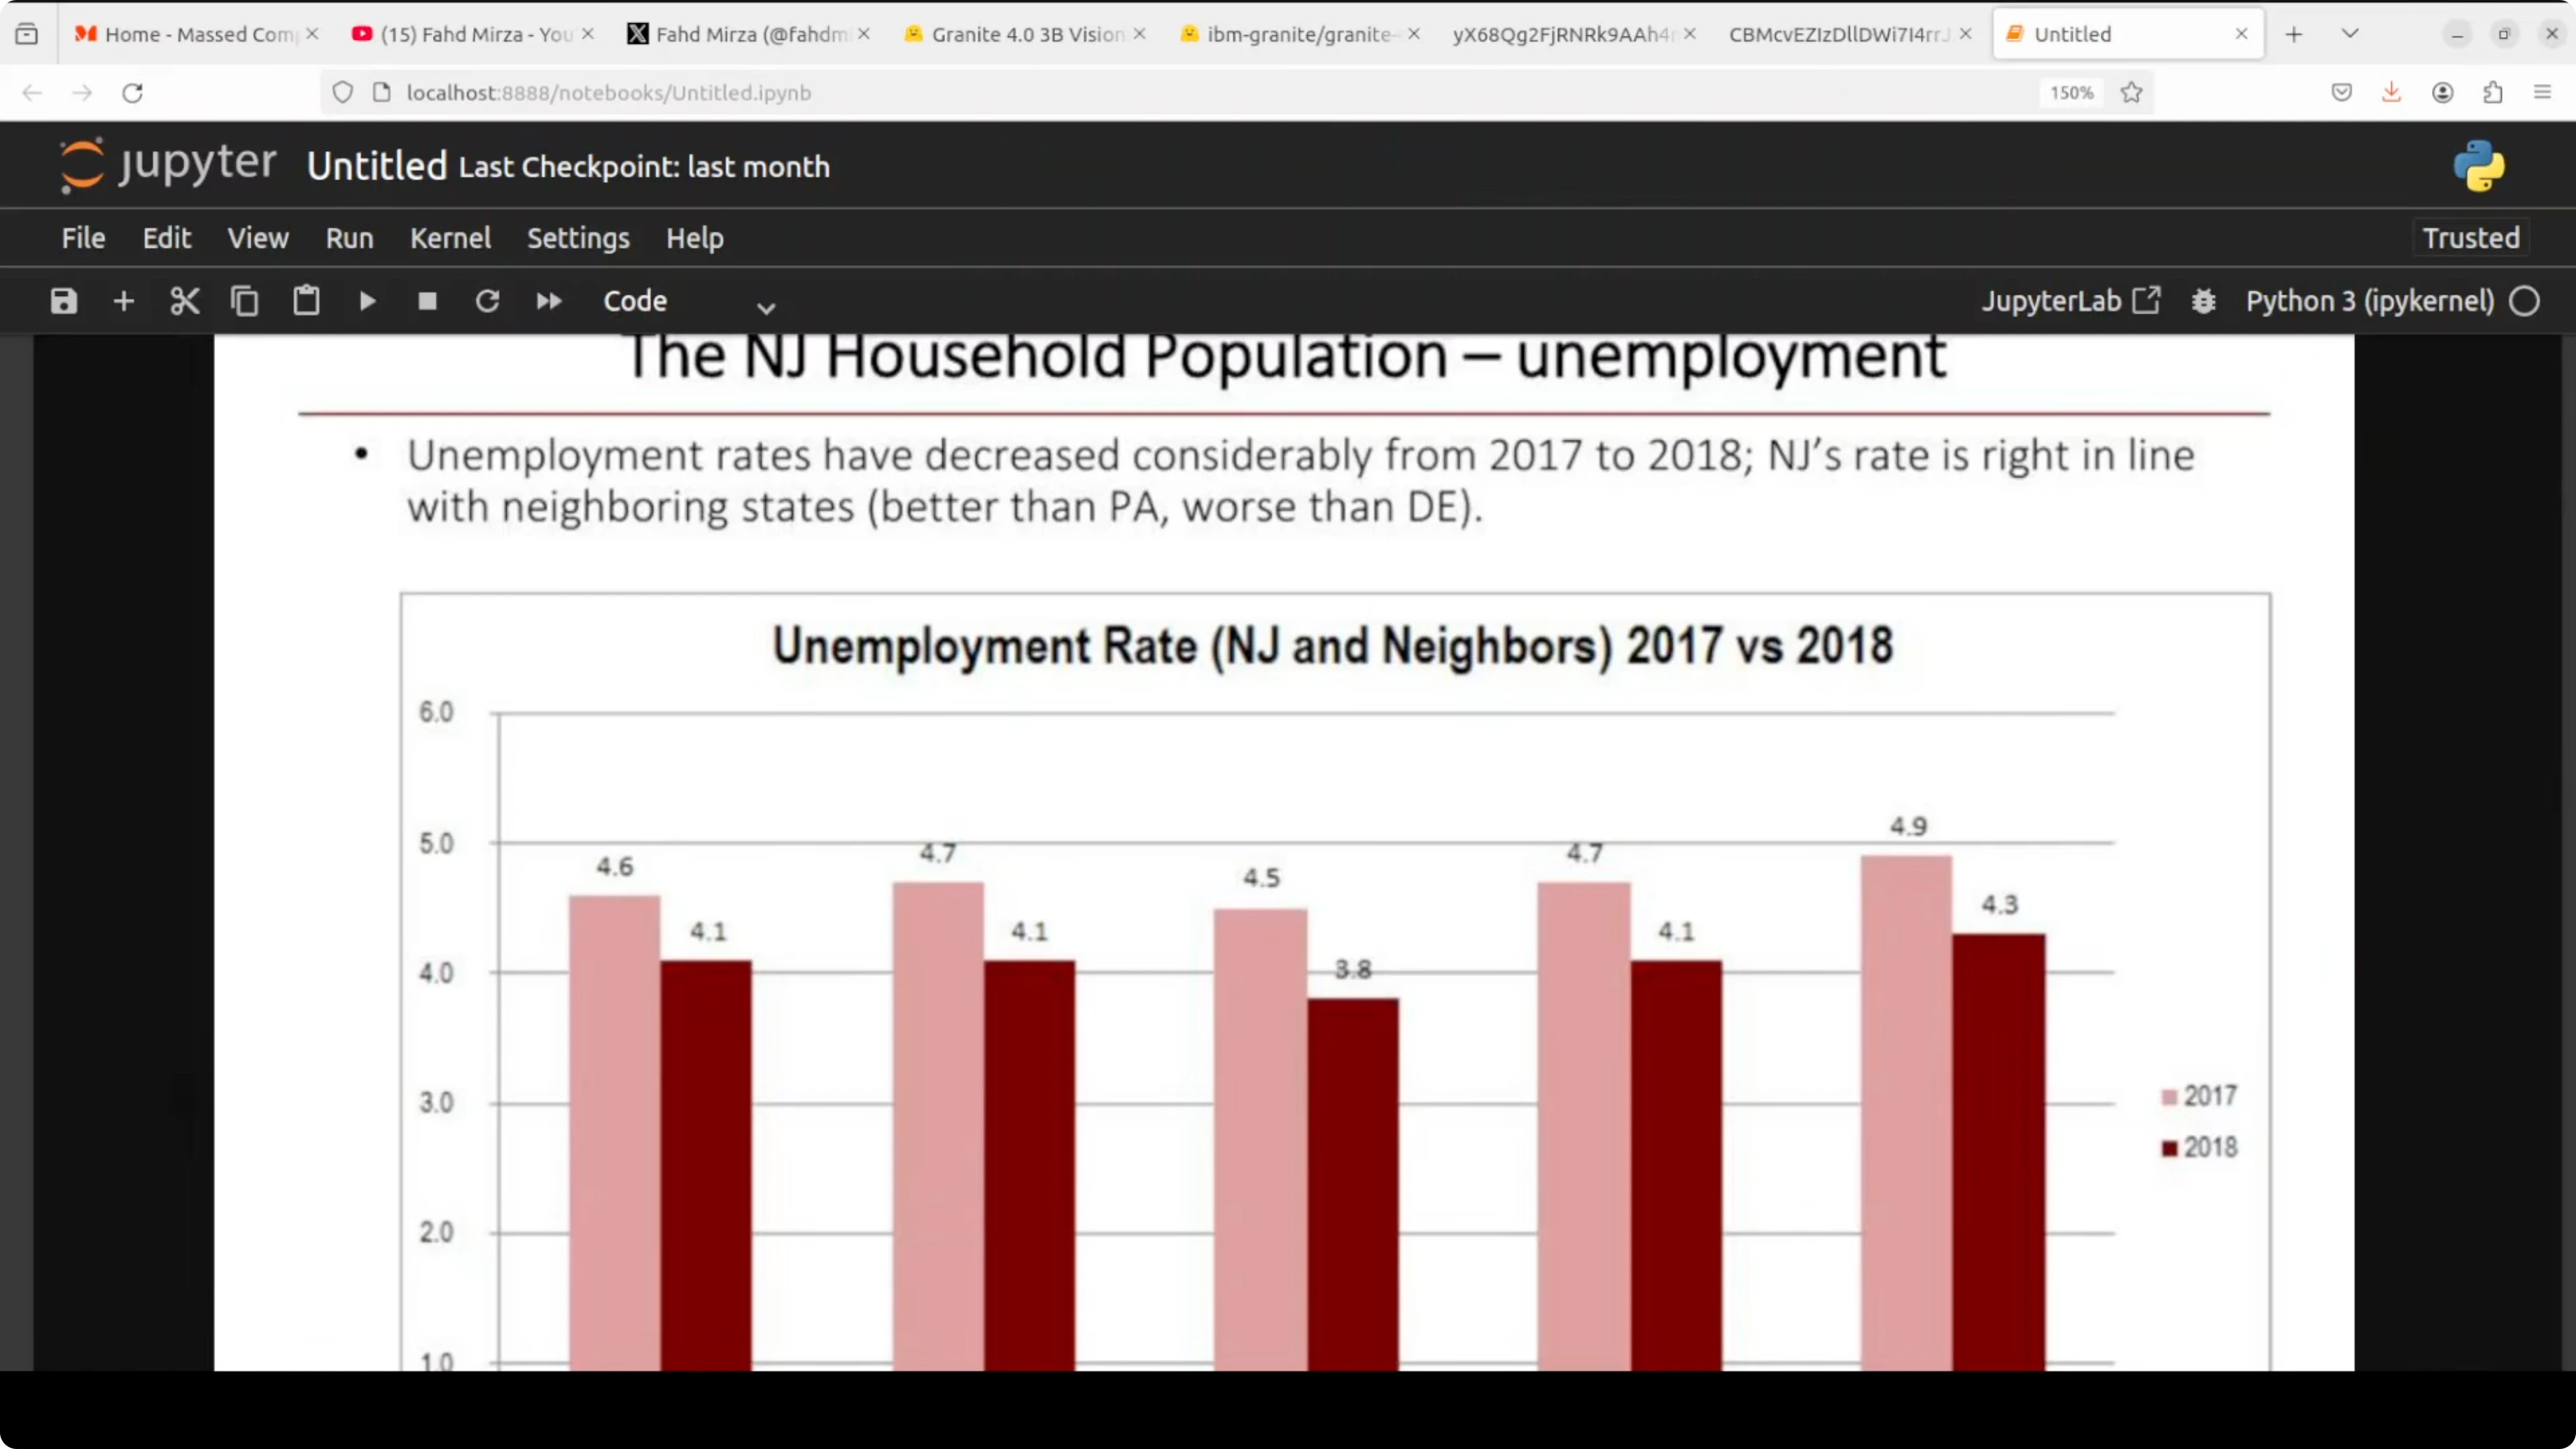
summary_prompt = (
"Summarize the chart image in 3-5 sentences. "
"Describe the trend, notable peaks or troughs, and any comparisons visible."
)
code_prompt = (
"Write Python code that recreates the chart shown in the image. "
"Prefer matplotlib. Include data arrays, labels, title, and styling to match the chart. "
"Return only a valid Python script."
)
csv_text = generate(chart_path, csv_prompt)
summary_text = generate(chart_path, summary_prompt)
code_text = generate(chart_path, code_prompt)
print(csv_text[:500])
print(summary_text)
print(code_text[:500])If you run the generated plotting script, install the dependencies first.
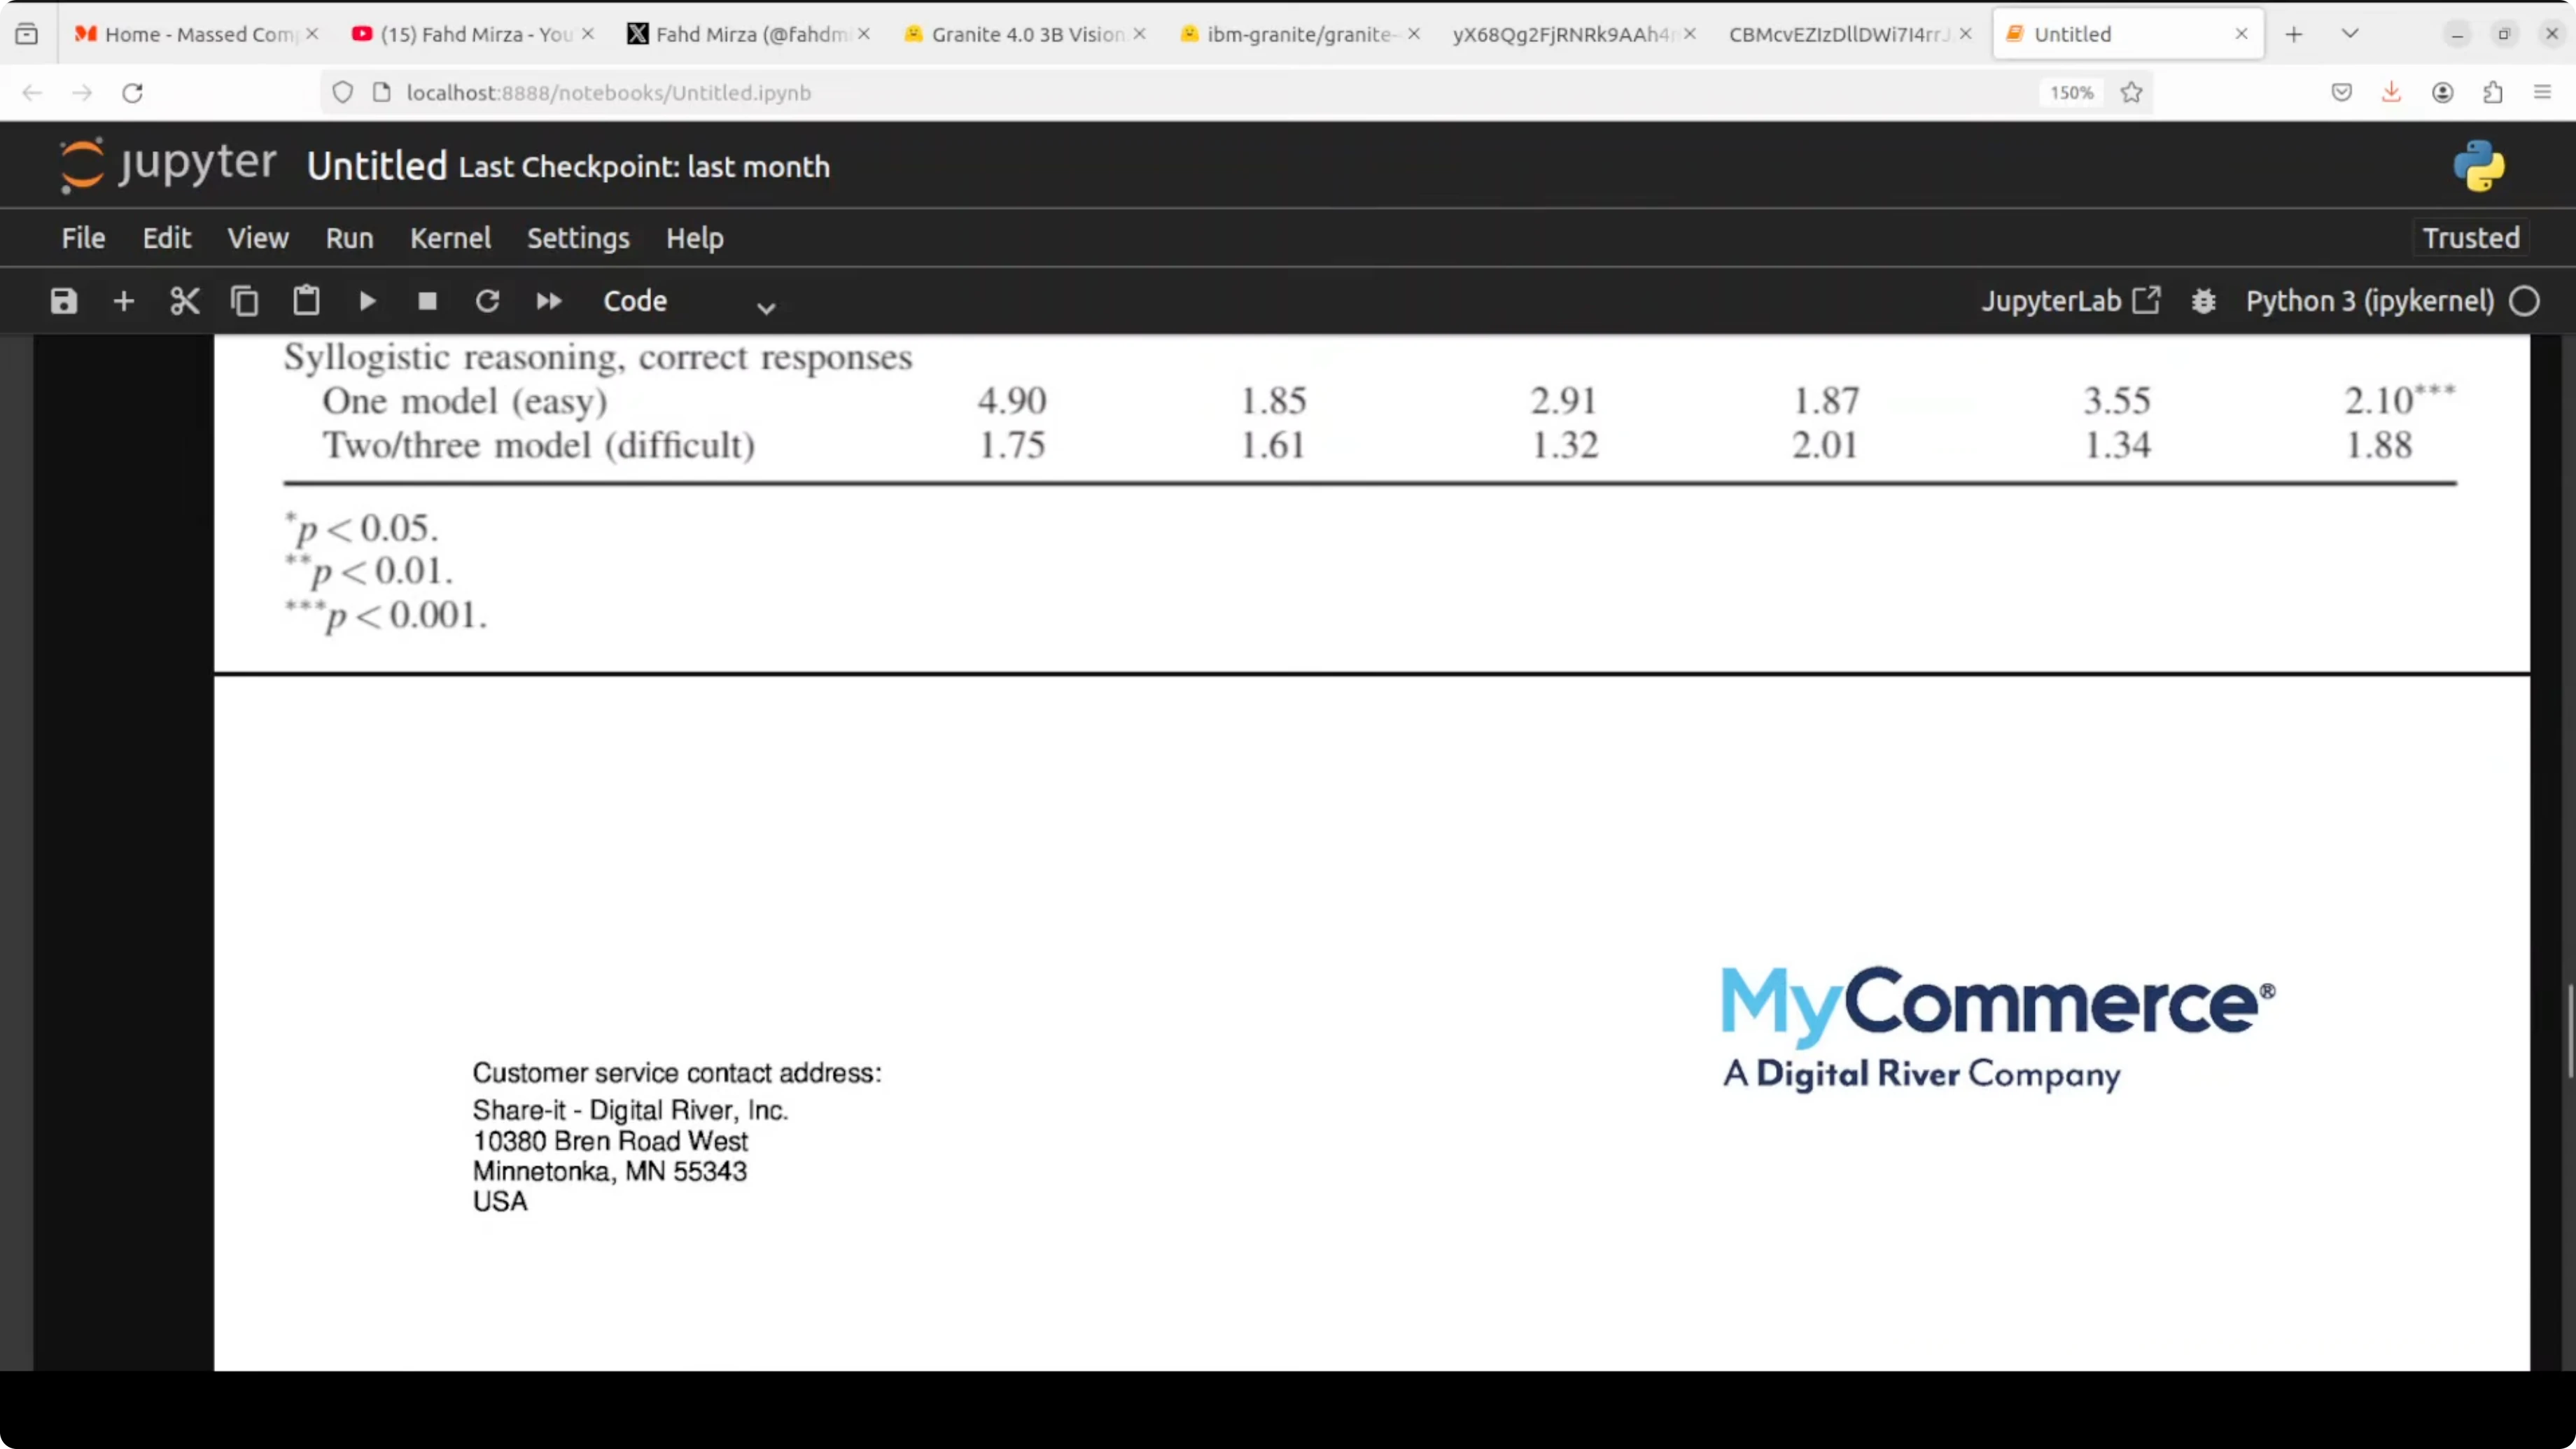
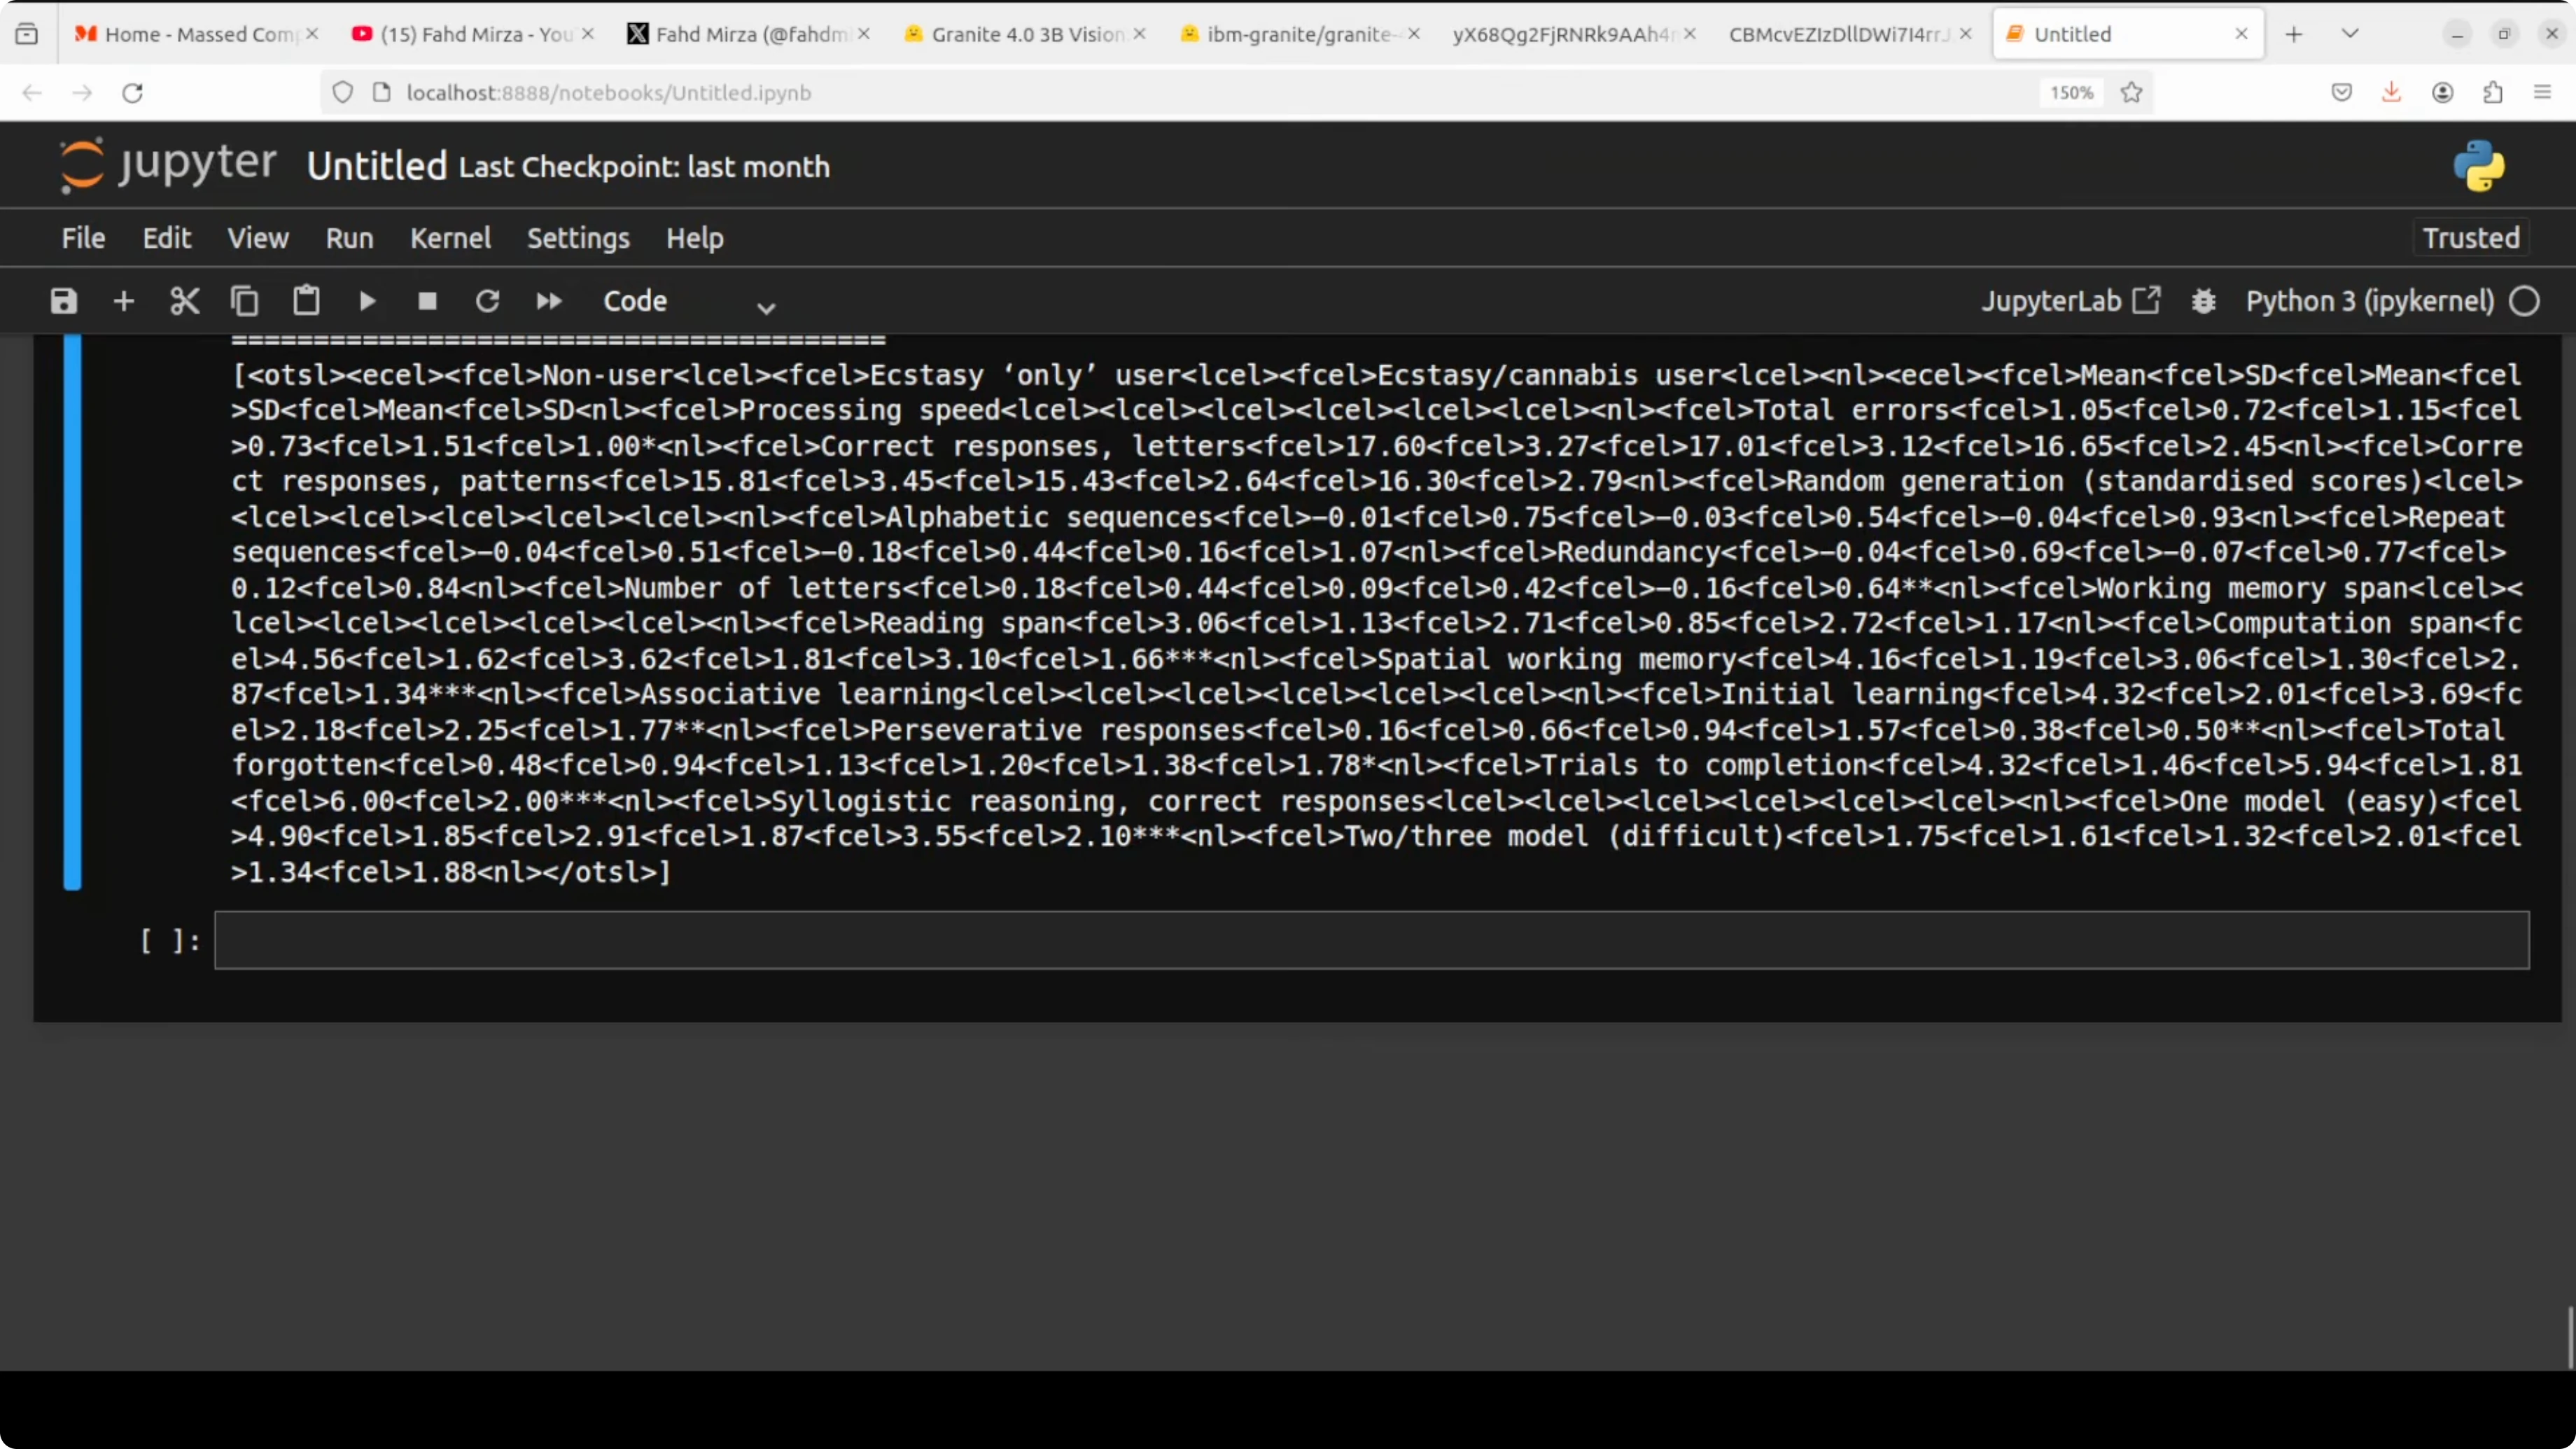
pip install matplotlib numpyTables to HTML and OTSL
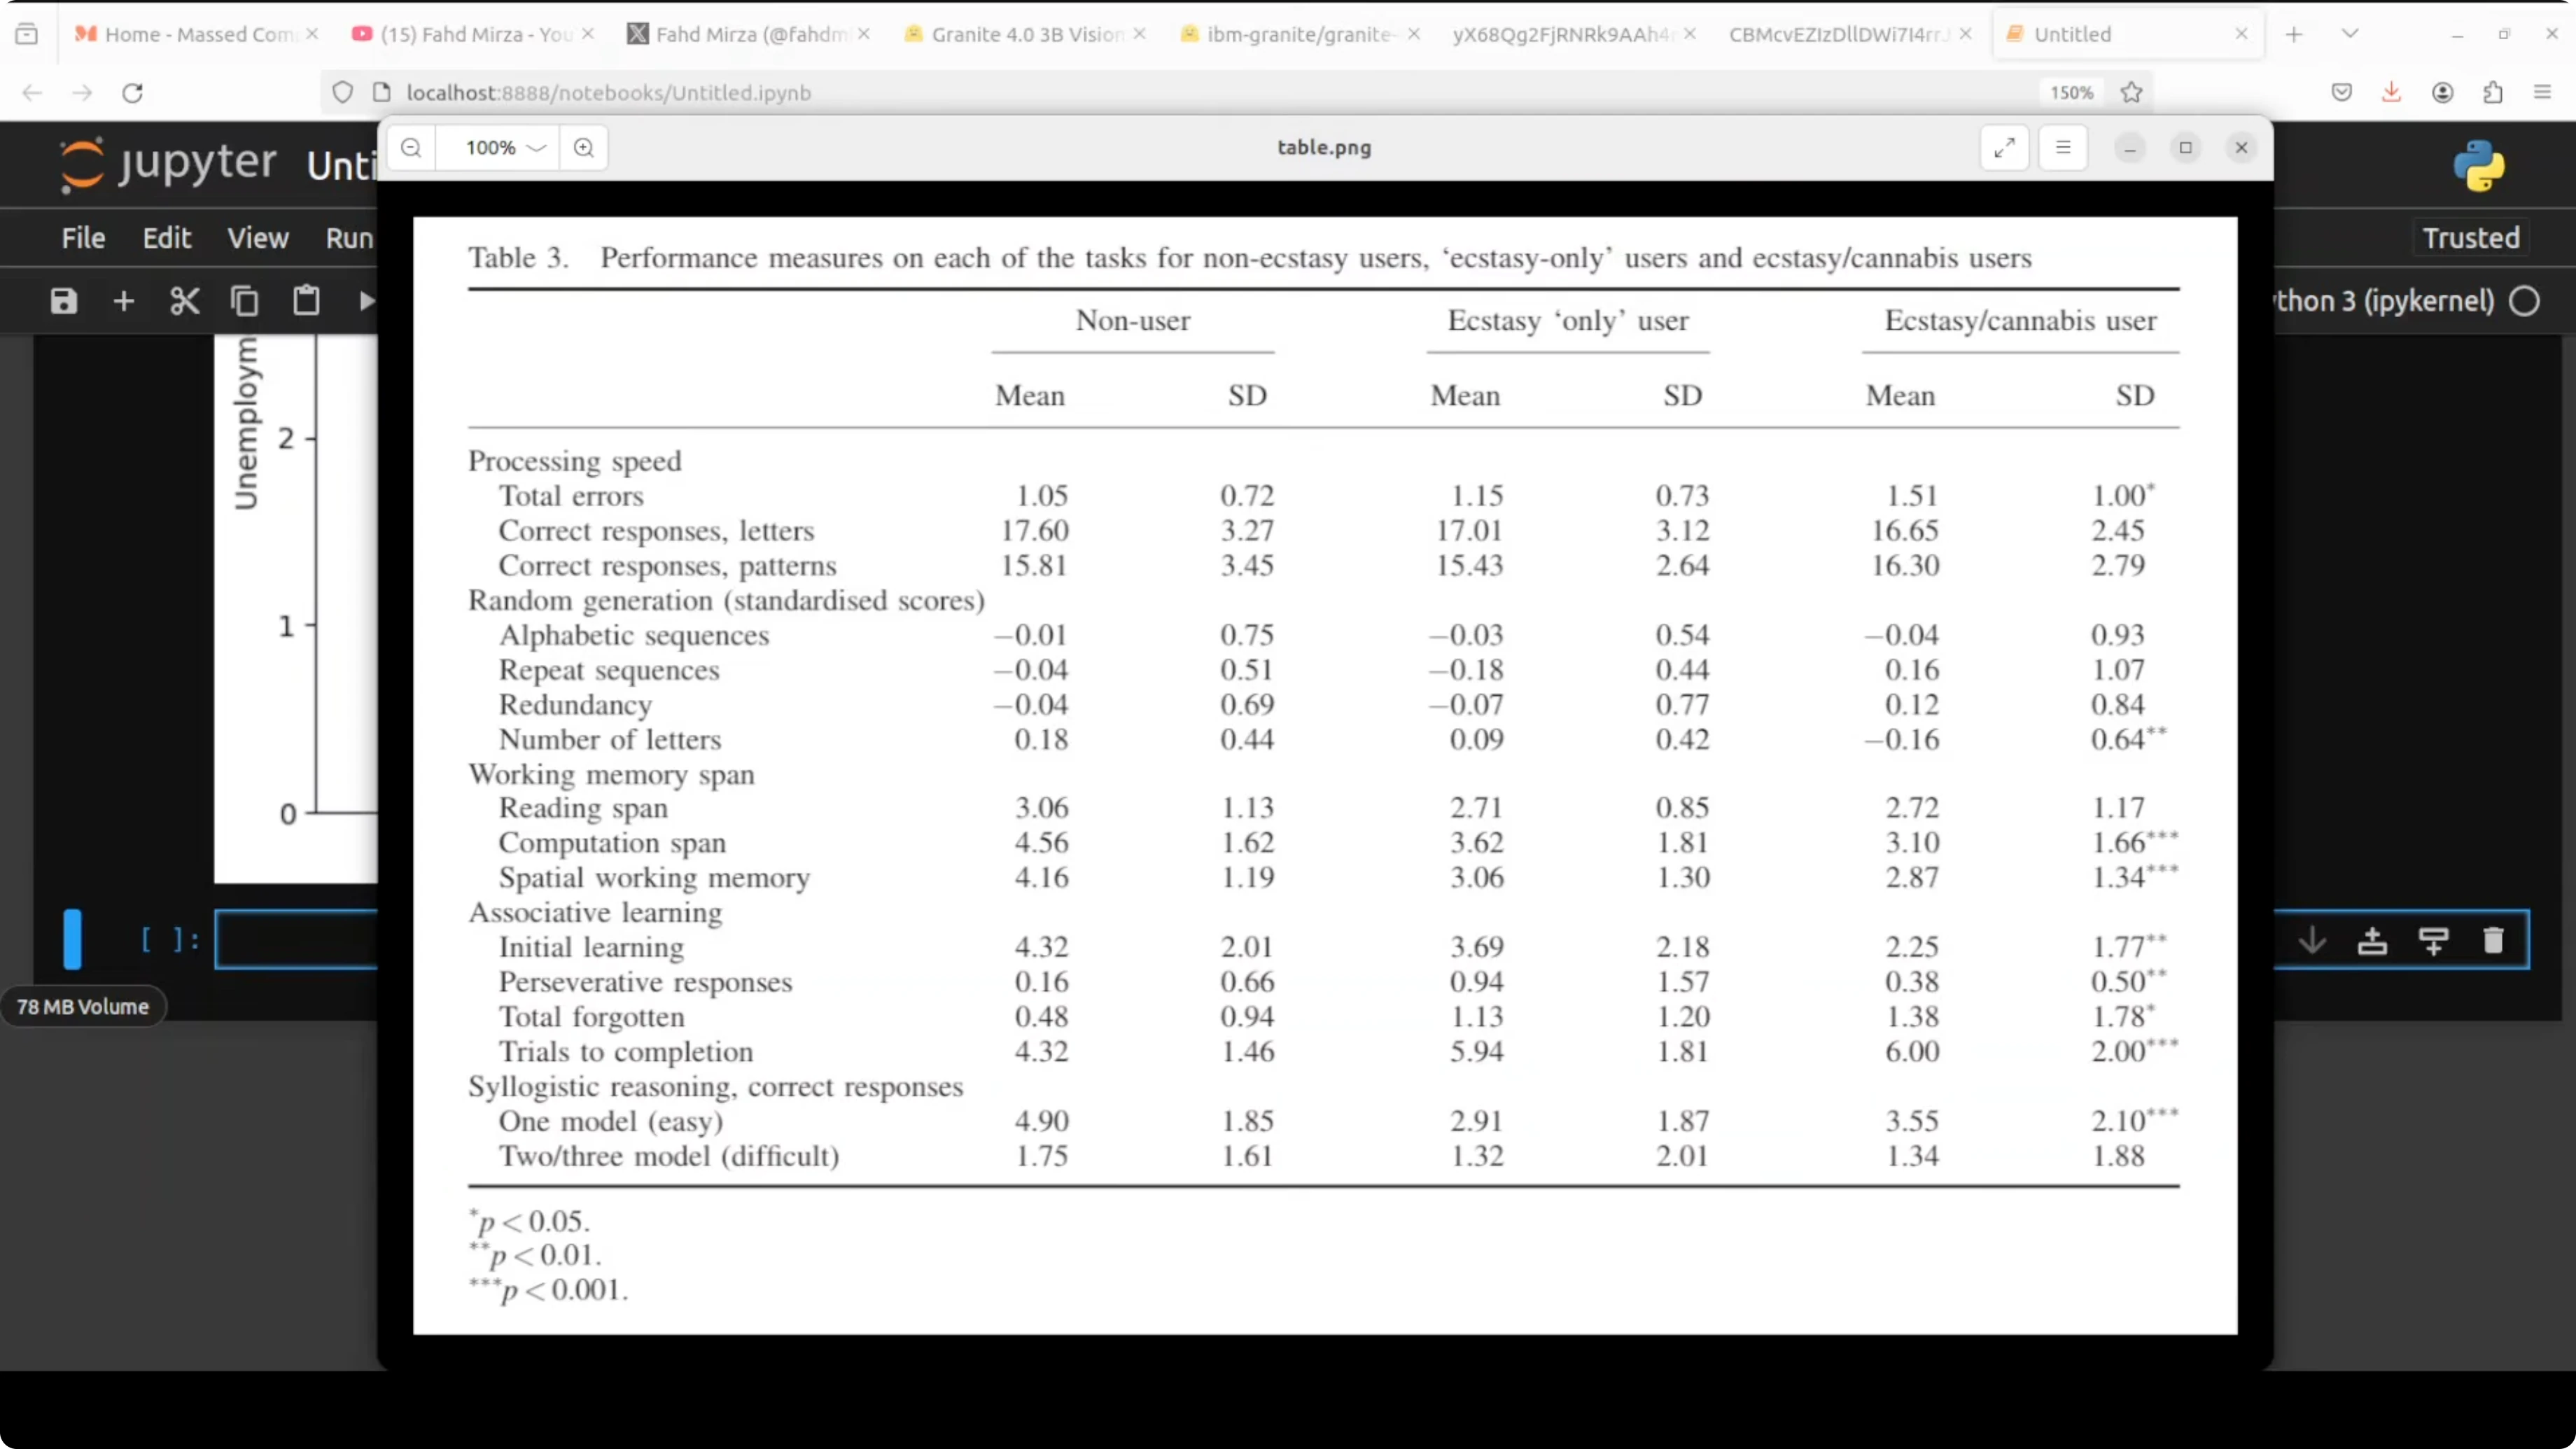
For complex academic or financial tables with merged cells and multi-level headers, request HTML or OTSL. OTSL is an optimized table structured language that encodes layout, cell spans, and boundaries more compactly than HTML for LLM processing.
table_path = "path/to/your/table.png"

html_prompt = (
    "Extract the table from the image and return valid HTML only. "
    "Preserve header hierarchy, row groups, and merged cells using thead/tbody and colspan/rowspan."
)

otsl_prompt = (
    "Extract the table from the image and return only OTSL markup. "
    "Encode cell boundaries, row and column spans, and header levels precisely."
)

html_text = generate(table_path, html_prompt, max_new_tokens=2048)
otsl_text = generate(table_path, otsl_prompt, max_new_tokens=2048)

print(html_text[:800])
print(otsl_text[:800])
If your workload involves comparing performance tiers across models, context from large model evaluations can help frame expectations. For a quick orientation, see Claude Opus 4.6 and the full breakdown of Claude Opus 4.6.
Invoices and forms to JSON
You can define a JSON schema and request precise field extraction. Keeping the schema explicit reduces drift and keeps outputs machine-ready.
invoice_path = "path/to/your/invoice.png"

schema = """
Return a JSON object with these fields:
{
  "invoice_number": "string",
  "invoice_date": "YYYY-MM-DD",
  "vendor_name": "string",
  "billing_address": "string",
  "total_amount": "number",
  "currency": "string",
  "line_items": [
    {
      "description": "string",
      "quantity": "number",
      "unit_price": "number",
      "amount": "number"
    }
  ]
}
Only return valid JSON, no comments.
"""

json_prompt = (
    "Extract key-value fields from the invoice image and map them to the schema.\n" + schema
)

json_text = generate(invoice_path, json_prompt, max_new_tokens=1024)
print(json_text)
If you are assessing system tradeoffs between newer releases, you may find it useful to review the differences between Claude Opus 4.6 and 4.5 as a reference for how capability increments are often packaged and tested.
Architecture notes
Granite 4 3B Vision uses the Granite 4 Micro backbone with a LoRA head for vision. LoRA, or low rank adaptation, fine-tunes a small number of adapter weights instead of all base parameters, then injects them at inference. The benefit is one deployment that serves text-only requests with the base model and vision requests by loading the adapter.
The vision encoder is SigLIP. Abstract semantic features are routed to earlier language layers across eight injection points for better spatial awareness and layout grounding. That routing is a key reason the model stays stable on dense document tasks.
ChartNet expands chart training coverage by generating plotting code and augmenting across libraries and chart types. Each synthetic example aligns code, image, data table, a short summary, and QA content to make supervision consistent. The benchmark result of 86.4% on chart-to-summary reflects that focus.
Step-by-step: local workflow
Create a project directory and venv.
mkdir granite-local && cd granite-local
python -m venv .venv && source .venv/bin/activate
Install dependencies and login.
pip install torch transformers accelerate peft pillow sentencepiece safetensors jupyter
huggingface-cli login
Download the base model and adapter, then merge to a single folder for inference.
export BASE_MODEL_ID="ibm-granite/REPLACE_WITH_GRANITE_4_MICRO_BASE"
export ADAPTER_ID="ibm-granite/REPLACE_WITH_3B_VISION_LORA_ADAPTER"
python merge_lora.py
Load the merged model and run chart, table, and invoice prompts against your images. Save CSV, HTML, OTSL, and JSON outputs to disk for downstream tasks. Profile VRAM and latency, then tune image resolution and max tokens to fit your GPU budget.
For broader Granite context across releases and capabilities, check the Granite 4 family overview again if you are planning upgrades or migration.
Use cases
Enterprise document processing needs consistent extraction under messy layouts. Invoices, purchase orders, and receipts can be parsed into strict JSON with field-level validation, then routed to ERP or payables.
Research and legal teams can convert multi-panel tables with merged headers into HTML or OTSL, then index them for search and analytics. BI teams can turn static dashboard charts into CSV or Python code to audit numbers, rebuild visuals, or run sensitivity checks.
Final thoughts
Granite 4 3B Vision is compact, runs locally, and targets the right tasks for real document workloads. The LoRA-based design keeps deployment simple for both text-only and vision requests. With solid chart and table extraction plus a permissive license, it is a practical addition to a local AI stack.
Subscribe to our newsletter
Get the latest updates and articles directly in your inbox.

Related Posts

8 Best Claude Code Plugins in 2026 (You Need to Know)
8 Best Claude Code Plugins in 2026 (You Need to Know)

7 Best Claude Code Skills (You Need to Know)
7 Best Claude Code Skills (You Need to Know)

Claude Code Desktop IDE Features (You Need to Know)
Claude Code Desktop IDE Features (You Need to Know)